29
/
en
AIzaSyAYiBZKx7MnpbEhh9jyipgxe19OcubqV5w
April 1, 2024
48353
Middle East & North Africa
MEA
false
2
1
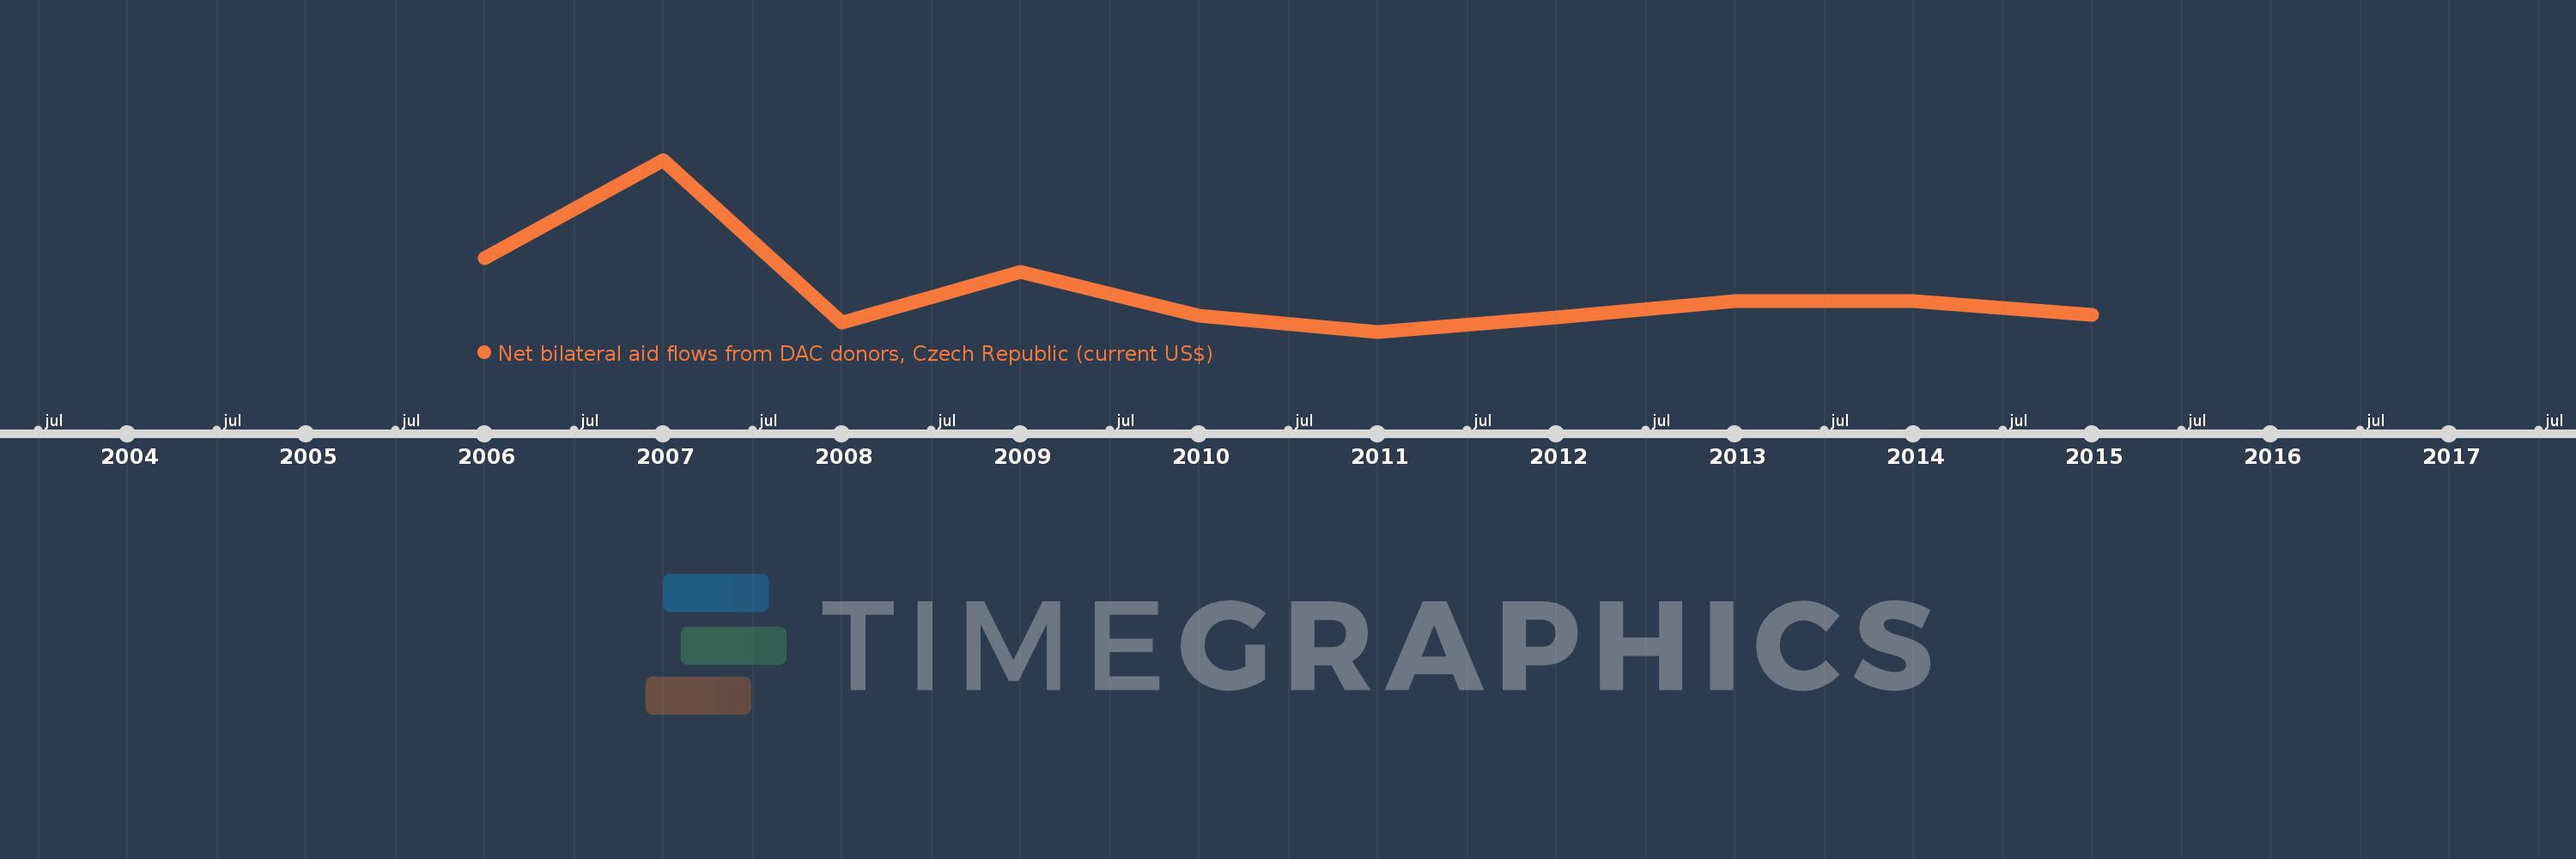
Net bilateral aid flows from DAC donors, Czech Republic (current US$)
2015,2014,2013,2012,2011,2010,2009,2008,2007,2006
This statistics in other country:
Timeline:
This timeline shows a graph from 2006 to 2015 of Middle East & North Africa. No data until 2005. Number of actual observations by date: 10.
Source name:
World Development Indicators
Source organization:
Development Assistance Committee of the Organisation for Economic Co-operation and Development, Geographical Distribution of Financial Flows to Developing Countries, Development Co-operation
Categories, topics:
Aid Effectiveness
Last updated:
apr 23, 2017
Indicators value changes by year
Minimum:
3.5 mln
jan 1, 2011
Maximum:
17.84 mln
jan 1, 2007
At the date of observation
Value
Absolute change
Change from previous value
jan 1, 2006
9.61 mln
+9.61 mln
0.0%
jan 1, 2007
17.84 mln
+8.23 mln
85.64%
jan 1, 2008
4.24 mln
-13.6 mln
-76.23%
jan 1, 2009
8.5 mln
+4.26 mln
100.47%
jan 1, 2010
4.85 mln
-3.65 mln
-42.94%
jan 1, 2011
3.5 mln
-1.35 mln
-27.84%
jan 1, 2012
4.71 mln
+1.21 mln
34.57%
jan 1, 2013
6.04 mln
+1.33 mln
28.24%
jan 1, 2014
6.03 mln
-10.0K
-0.17%
jan 1, 2015
4.92 mln
-1.11 mln
-18.41%
Ranking of countries by current statistics by years


Comments: