29
/
en
AIzaSyAYiBZKx7MnpbEhh9jyipgxe19OcubqV5w
April 1, 2024
60996
Sub-Saharan Africa (IDA & IBRD countries)
TSS
false
2
1
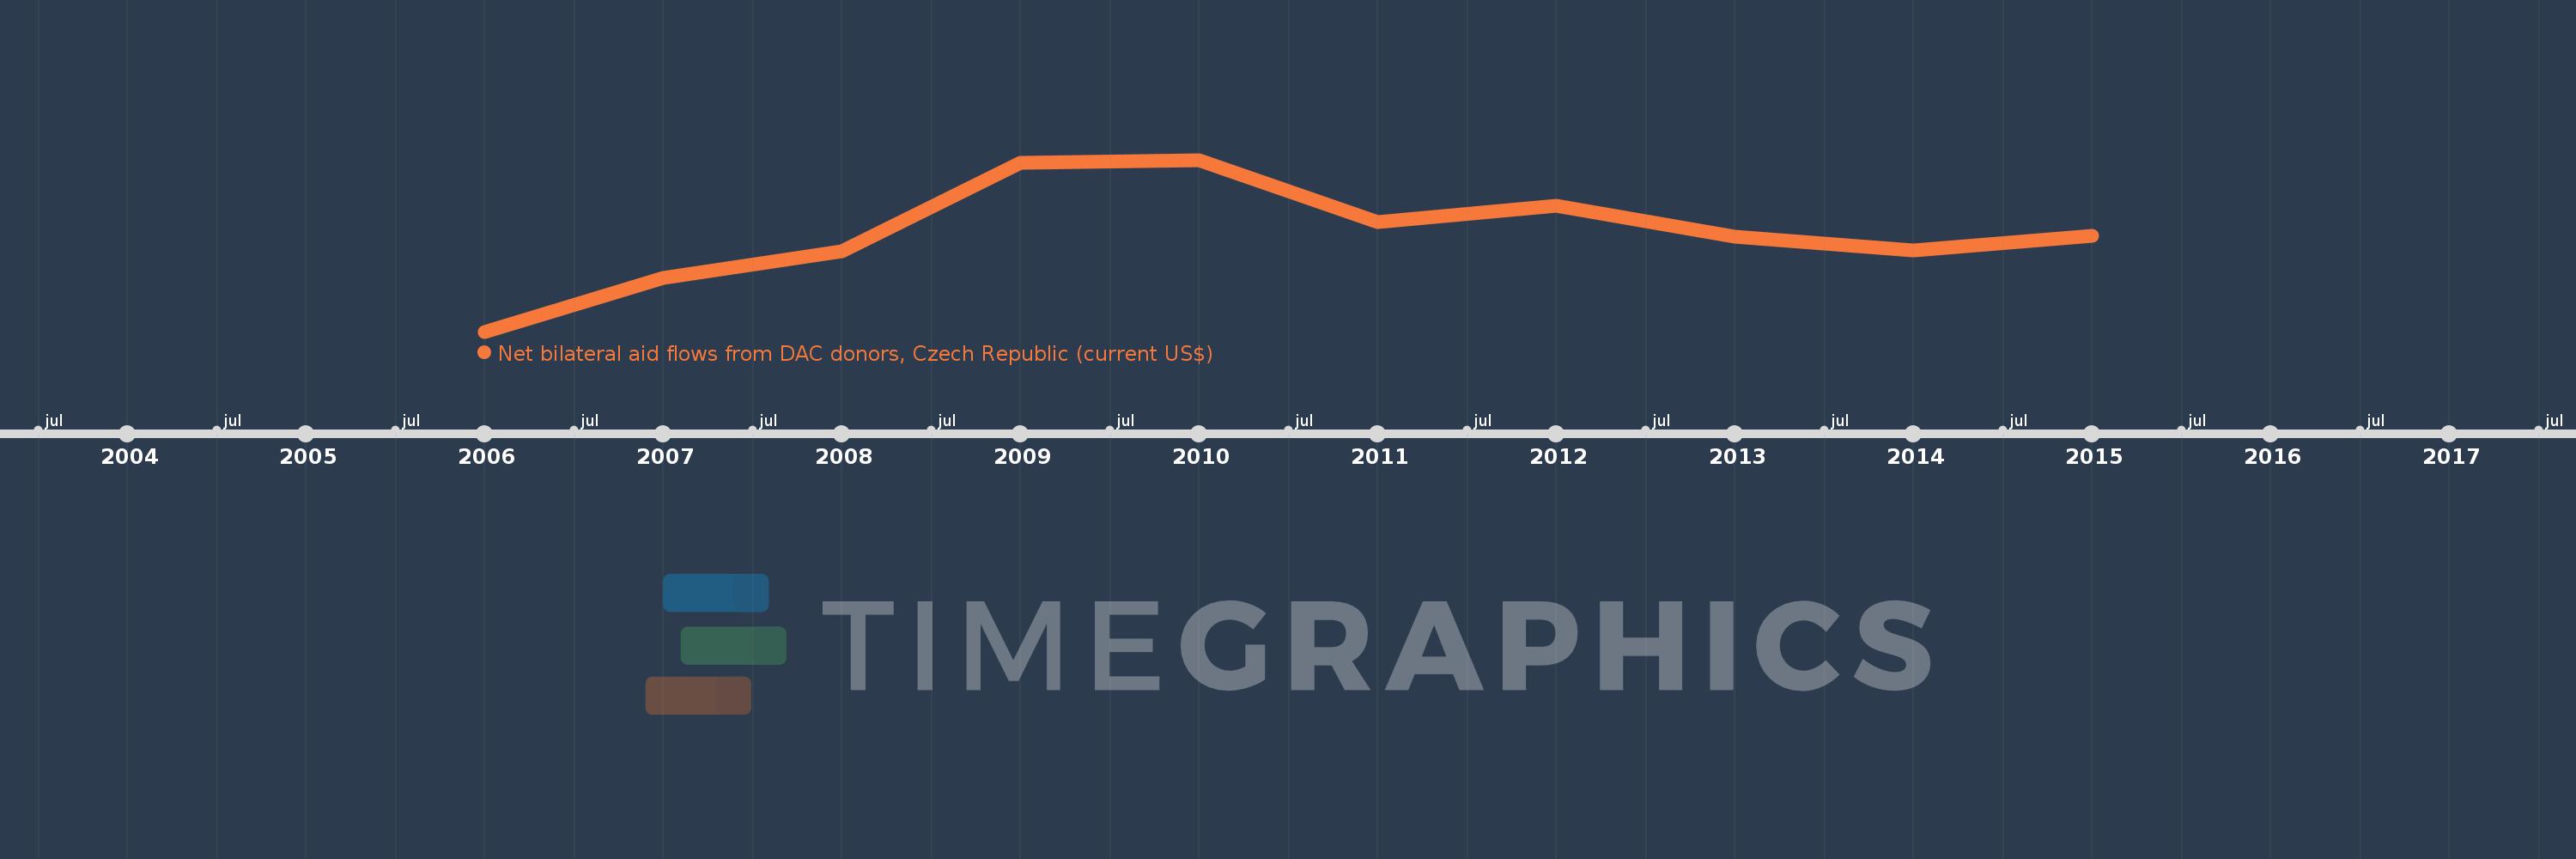
Net bilateral aid flows from DAC donors, Czech Republic (current US$)
2015,2014,2013,2012,2011,2010,2009,2008,2007,2006
This statistics in other country:
Timeline:
This timeline shows a graph from 2006 to 2015 of Sub-Saharan Africa (IDA & IBRD countries). No data until 2005. Number of actual observations by date: 10.
Source name:
World Development Indicators
Source organization:
Development Assistance Committee of the Organisation for Economic Co-operation and Development, Geographical Distribution of Financial Flows to Developing Countries, Development Co-operation
Categories, topics:
Aid Effectiveness
Last updated:
apr 23, 2017
Indicators value changes by year
Minimum:
4.01 mln
jan 1, 2006
Maximum:
9.55 mln
jan 1, 2010
At the date of observation
Value
Absolute change
Change from previous value
jan 1, 2006
4.01 mln
+4.01 mln
0.0%
jan 1, 2007
5.74 mln
+1.73 mln
43.14%
jan 1, 2008
6.59 mln
+850.0K
14.81%
jan 1, 2009
9.44 mln
+2.85 mln
43.25%
jan 1, 2010
9.55 mln
+110.0K
1.17%
jan 1, 2011
7.53 mln
-2.02 mln
-21.15%
jan 1, 2012
8.07 mln
+540.0K
7.17%
jan 1, 2013
7.07 mln
-1000.0K
-12.39%
jan 1, 2014
6.62 mln
-450.0K
-6.36%
jan 1, 2015
7.09 mln
+470.0K
7.1%
Ranking of countries by current statistics by years


Comments: