29
/
en
AIzaSyAYiBZKx7MnpbEhh9jyipgxe19OcubqV5w
April 1, 2024
33704
European Union
EUU
false
2
1
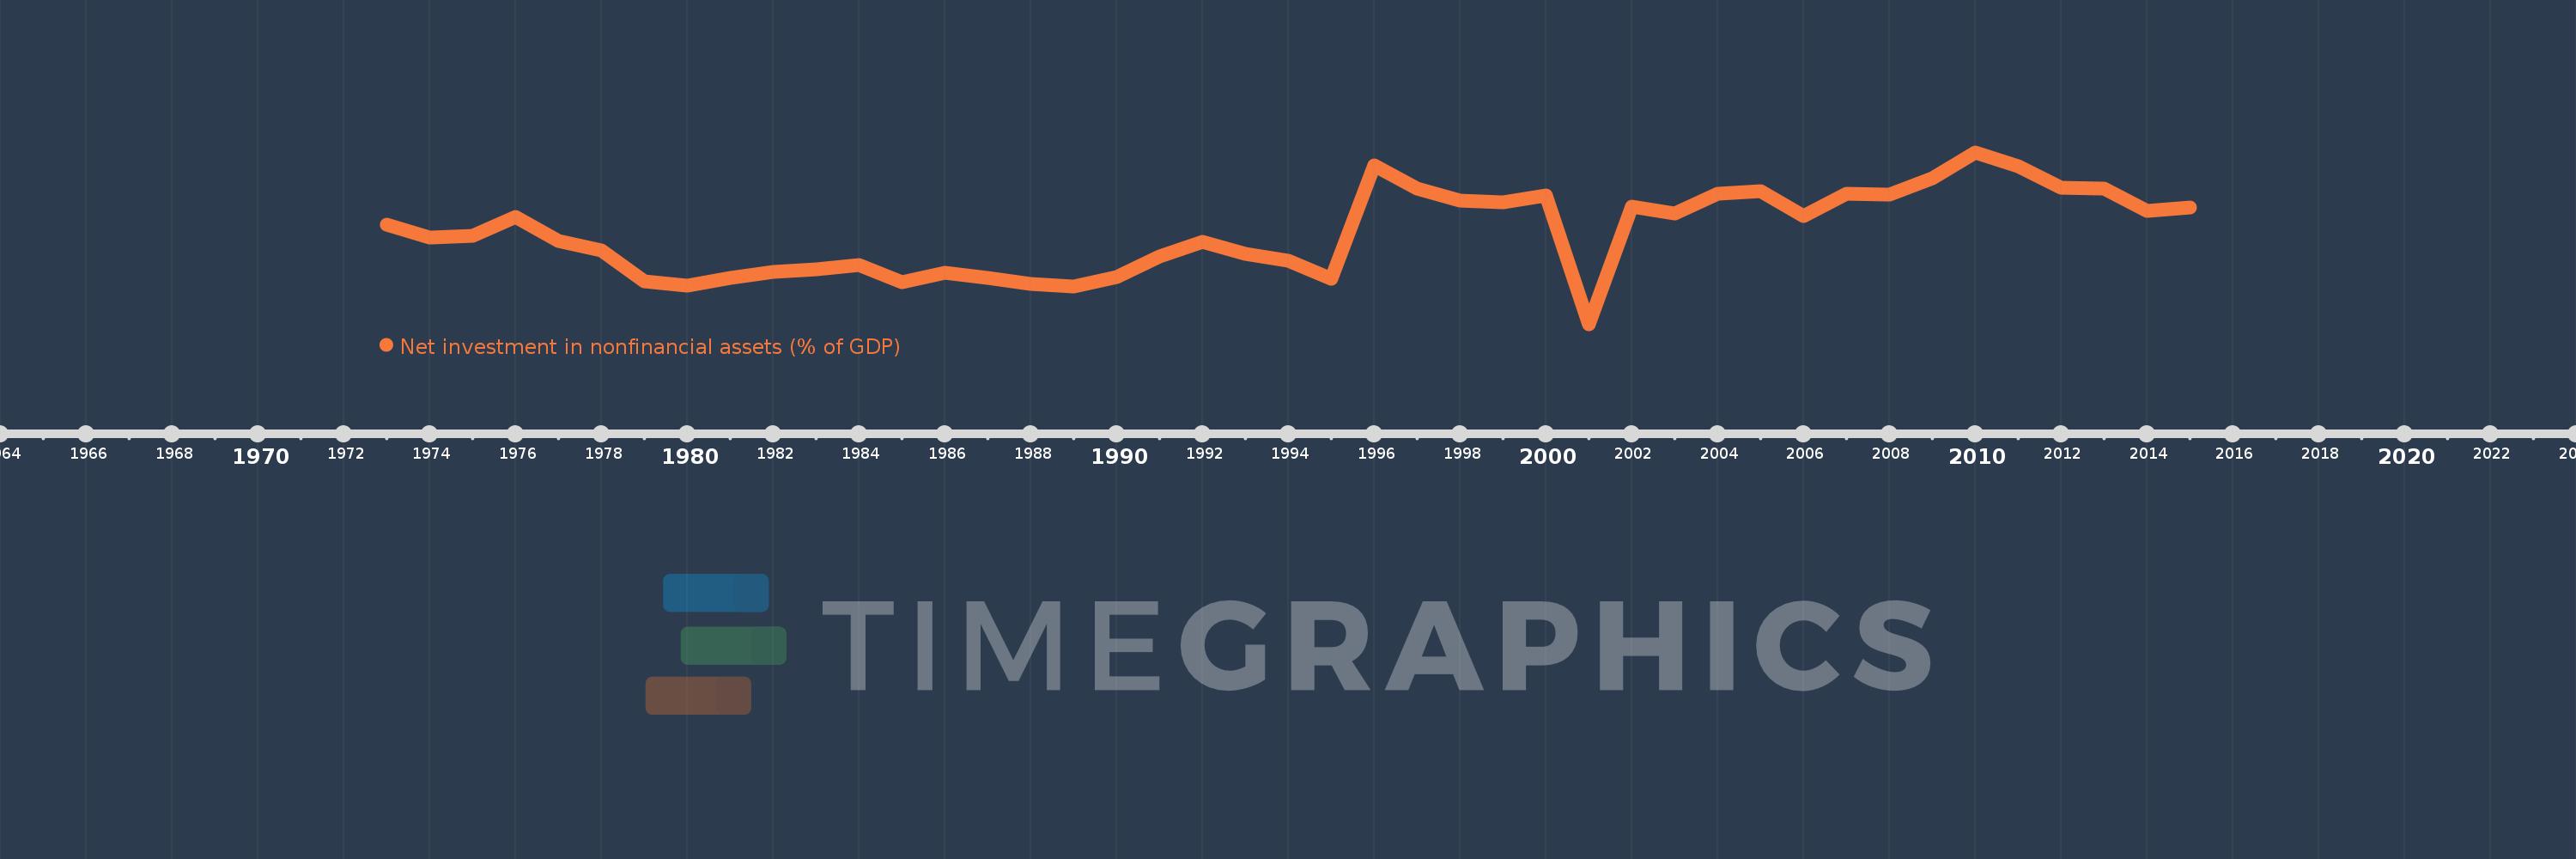
Net investment in nonfinancial assets (% of GDP)
2015,2014,2013,2012,2011,2010,2009,2008,2007,2006,2005,2004,2003,2002,2001,2000,1999,1998,1997,1996,1995,1994,1993,1992,1991,1990,1989,1988,1987,1986,1985,1984,1983,1982,1981,1980,1979,1978,1977,1976,1975,1974,1973
This statistics in other country:
AfghanistanAlbaniaAlgeriaAngolaAntigua and BarbudaArmeniaAustraliaAustriaAzerbaijanBahamas, TheBahrainBangladeshBarbadosBelarusBelgiumBelizeBhutanBoliviaBosnia and HerzegovinaBrazilBurundiCabo VerdeCambodiaCanadaCaribbean small statesCentral African RepublicCentral Europe and the BalticsChileChinaCongo, Dem. Rep.Congo, Rep.Costa RicaCote d'IvoireCroatiaCyprusCzech RepublicDenmarkDominicaDominican RepublicEarly-demographic dividendEast Asia & Pacific (excluding high income)East Asia & Pacific (IDA & IBRD countries)Egypt, Arab Rep.El SalvadorEquatorial GuineaEstoniaEthiopiaEuro areaEurope & Central AsiaEurope & Central Asia (excluding high income)Europe & Central Asia (IDA & IBRD countries)European UnionFijiFinlandFranceGambia, TheGeorgiaGermanyGreeceGuatemalaHigh incomeHondurasHungaryIBRD onlyIcelandIDA & IBRD totalIDA blendIndiaIndonesiaIran, Islamic Rep.IraqIrelandIsraelItalyJamaicaKazakhstanKiribatiKorea, Rep.Kyrgyz RepublicLao PDRLate-demographic dividendLatin America & Caribbean Latin America & Caribbean (excluding high income)Latin America & the Caribbean (IDA & IBRD countries)LatviaLebanonLithuaniaLow & middle incomeLower middle incomeLuxembourgMacao SAR, ChinaMacedonia, FYRMadagascarMalawiMaldivesMaliMaltaMauritiusMexicoMicronesia, Fed. Sts.Middle East & North Africa (excluding high income)Middle East & North Africa (IDA & IBRD countries)Middle incomeMoldovaMongoliaMoroccoMozambiqueNamibiaNepalNetherlandsNew ZealandNicaraguaNigeriaNorth AmericaNorwayOECD membersOmanOther small statesPacific island small statesPakistanParaguayPeruPhilippinesPolandPortugalPost-demographic dividendQatarRomaniaRussian FederationRwandaSamoaSan MarinoSao Tome and PrincipeSenegalSerbiaSierra LeoneSingaporeSlovak RepublicSmall statesSolomon IslandsSouth AfricaSouth AsiaSouth Asia (IDA & IBRD)SpainSri LankaSub-Saharan Africa Sub-Saharan Africa (excluding high income)Sub-Saharan Africa (IDA & IBRD countries)SurinameSwazilandSwedenSwitzerlandSyrian Arab RepublicThailandTimor-LesteTrinidad and TobagoTurkeyUgandaUkraineUnited Arab EmiratesUnited KingdomUnited StatesUpper middle incomeUruguayVanuatuVietnamWest Bank and GazaWorldYemen, Rep.Zimbabwe Timeline:
This timeline shows a graph from 1973 to 2015 of European Union. No data until 1972. Number of actual observations by date: 43.
Source name:
World Development Indicators
Source organization:
International Monetary Fund, Government Finance Statistics Yearbook and data files.
Categories, topics:
Public Sector
Last updated:
apr 23, 2017
Indicators value changes by year
At the date of observation
Value
Absolute change
Change from previous value
jan 1, 1973
1.16
+1.16
0.0%
jan 1, 1974
1.082
-0.077
-6.67%
jan 1, 1975
1.091
+0.009
0.82%
jan 1, 1976
1.211
+0.12
10.98%
jan 1, 1977
1.059
-0.151
-12.49%
jan 1, 1978
0.999
-0.061
-5.75%
jan 1, 1979
0.802
-0.197
-19.72%
jan 1, 1980
0.779
-0.023
-2.84%
jan 1, 1981
0.823
+0.045
5.73%
jan 1, 1982
0.862
+0.038
4.65%
jan 1, 1983
0.88
+0.018
2.06%
jan 1, 1984
0.907
+0.028
3.16%
jan 1, 1985
0.797
-0.11
-12.11%
jan 1, 1986
0.86
+0.062
7.82%
jan 1, 1987
0.824
-0.036
-4.16%
jan 1, 1988
0.789
-0.035
-4.28%
jan 1, 1989
0.769
-0.019
-2.44%
jan 1, 1990
0.83
+0.061
7.88%
jan 1, 1991
0.962
+0.132
15.86%
jan 1, 1992
1.054
+0.093
9.62%
jan 1, 1993
0.978
-0.076
-7.22%
jan 1, 1994
0.932
-0.046
-4.73%
jan 1, 1995
0.82
-0.112
-12.03%
jan 1, 1996
1.532
+0.712
86.84%
jan 1, 1997
1.39
-0.142
-9.26%
jan 1, 1998
1.314
-0.076
-5.45%
jan 1, 1999
1.304
-0.011
-0.8%
jan 1, 2000
1.347
+0.043
3.32%
jan 1, 2001
0.534
-0.812
-60.33%
jan 1, 2002
1.277
+0.743
139.04%
jan 1, 2003
1.231
-0.047
-3.65%
jan 1, 2004
1.354
+0.123
10.03%
jan 1, 2005
1.374
+0.02
1.49%
jan 1, 2006
1.213
-0.161
-11.71%
jan 1, 2007
1.355
+0.141
11.64%
jan 1, 2008
1.35
-0.005
-0.37%
jan 1, 2009
1.455
+0.105
7.79%
jan 1, 2010
1.616
+0.161
11.07%
jan 1, 2011
1.531
-0.085
-5.27%
jan 1, 2012
1.392
-0.138
-9.05%
jan 1, 2013
1.388
-0.004
-0.28%
jan 1, 2014
1.249
-0.139
-10.05%
jan 1, 2015
1.271
+0.022
1.77%
Ranking of countries by current statistics by years


Comments: