29
/
en
AIzaSyAYiBZKx7MnpbEhh9jyipgxe19OcubqV5w
April 1, 2024
73275
Australia
AUS
true
2
1
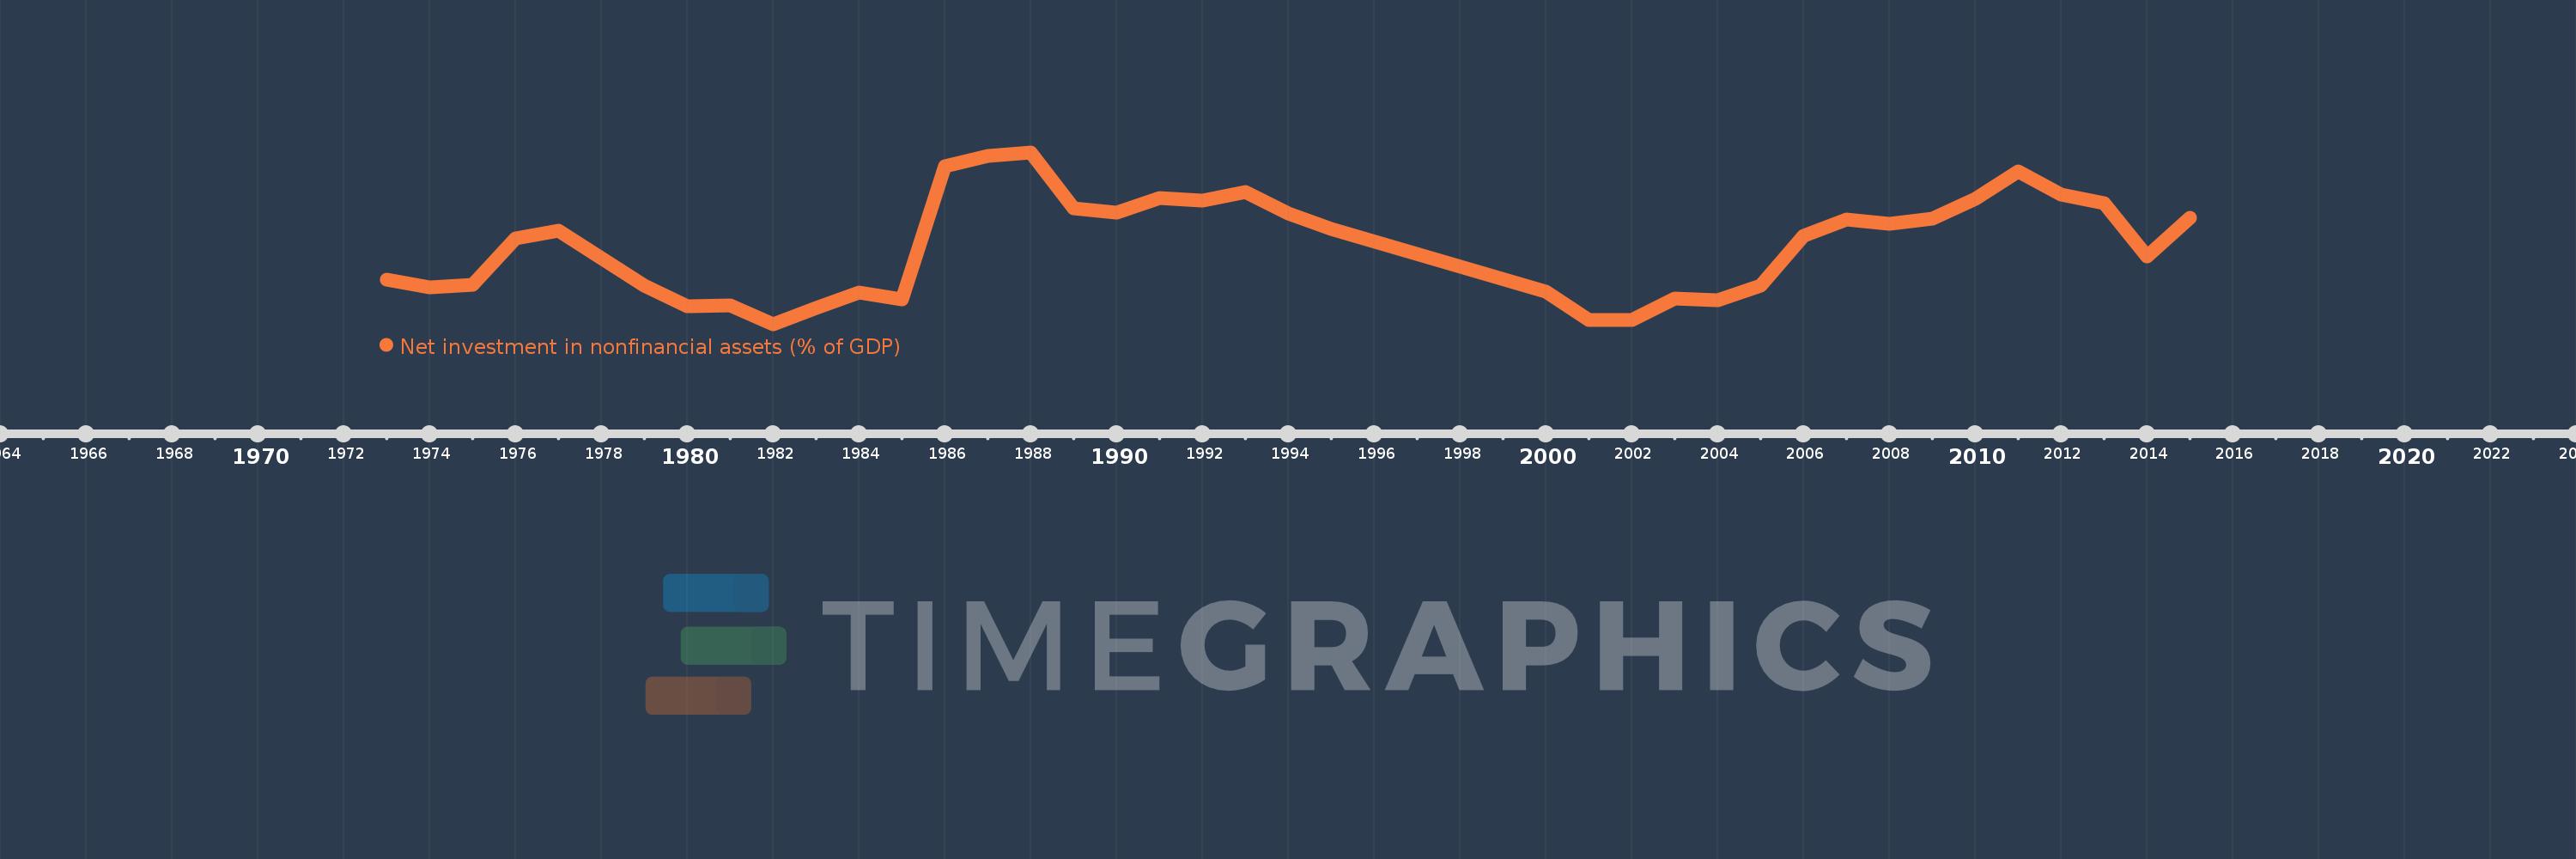
Net investment in nonfinancial assets (% of GDP)
2015,2014,2013,2012,2011,2010,2009,2008,2007,2006,2005,2004,2003,2002,2001,2000,1995,1994,1993,1992,1991,1990,1989,1988,1987,1986,1985,1984,1983,1982,1981,1980,1979,1978,1977,1976,1975,1974,1973
This statistics in other country:
AfghanistanAlbaniaAlgeriaAngolaAntigua and BarbudaArmeniaAustraliaAustriaAzerbaijanBahamas, TheBahrainBangladeshBarbadosBelarusBelgiumBelizeBhutanBoliviaBosnia and HerzegovinaBrazilBurundiCabo VerdeCambodiaCanadaCaribbean small statesCentral African RepublicCentral Europe and the BalticsChileChinaCongo, Dem. Rep.Congo, Rep.Costa RicaCote d'IvoireCroatiaCyprusCzech RepublicDenmarkDominicaDominican RepublicEarly-demographic dividendEast Asia & Pacific (excluding high income)East Asia & Pacific (IDA & IBRD countries)Egypt, Arab Rep.El SalvadorEquatorial GuineaEstoniaEthiopiaEuro areaEurope & Central AsiaEurope & Central Asia (excluding high income)Europe & Central Asia (IDA & IBRD countries)European UnionFijiFinlandFranceGambia, TheGeorgiaGermanyGreeceGuatemalaHigh incomeHondurasHungaryIBRD onlyIcelandIDA & IBRD totalIDA blendIndiaIndonesiaIran, Islamic Rep.IraqIrelandIsraelItalyJamaicaKazakhstanKiribatiKorea, Rep.Kyrgyz RepublicLao PDRLate-demographic dividendLatin America & Caribbean Latin America & Caribbean (excluding high income)Latin America & the Caribbean (IDA & IBRD countries)LatviaLebanonLithuaniaLow & middle incomeLower middle incomeLuxembourgMacao SAR, ChinaMacedonia, FYRMadagascarMalawiMaldivesMaliMaltaMauritiusMexicoMicronesia, Fed. Sts.Middle East & North Africa (excluding high income)Middle East & North Africa (IDA & IBRD countries)Middle incomeMoldovaMongoliaMoroccoMozambiqueNamibiaNepalNetherlandsNew ZealandNicaraguaNigeriaNorth AmericaNorwayOECD membersOmanOther small statesPacific island small statesPakistanParaguayPeruPhilippinesPolandPortugalPost-demographic dividendQatarRomaniaRussian FederationRwandaSamoaSan MarinoSao Tome and PrincipeSenegalSerbiaSierra LeoneSingaporeSlovak RepublicSmall statesSolomon IslandsSouth AfricaSouth AsiaSouth Asia (IDA & IBRD)SpainSri LankaSub-Saharan Africa Sub-Saharan Africa (excluding high income)Sub-Saharan Africa (IDA & IBRD countries)SurinameSwazilandSwedenSwitzerlandSyrian Arab RepublicThailandTimor-LesteTrinidad and TobagoTurkeyUgandaUkraineUnited Arab EmiratesUnited KingdomUnited StatesUpper middle incomeUruguayVanuatuVietnamWest Bank and GazaWorldYemen, Rep.Zimbabwe Timeline:
This timeline shows a graph from 1973 to 2015 of Australia. No data until 1972. Number of actual observations by date: 39.
Source name:
World Development Indicators
Source organization:
International Monetary Fund, Government Finance Statistics Yearbook and data files.
Categories, topics:
Public Sector
Last updated:
apr 23, 2017
Indicators value changes by year
At the date of observation
Value
Absolute change
Change from previous value
jan 1, 1973
0.439
+0.439
0.0%
jan 1, 1974
0.39
-0.048
-11.04%
jan 1, 1975
0.408
+0.018
4.65%
jan 1, 1976
0.703
+0.295
72.21%
jan 1, 1977
0.752
+0.048
6.87%
jan 1, 1978
0.576
-0.176
-23.35%
jan 1, 1979
0.405
-0.171
-29.62%
jan 1, 1980
0.273
-0.133
-32.76%
jan 1, 1981
0.276
+0.004
1.31%
jan 1, 1982
0.156
-0.12
-43.57%
jan 1, 1983
0.262
+0.106
68.14%
jan 1, 1984
0.36
+0.098
37.26%
jan 1, 1985
0.313
-0.047
-12.96%
jan 1, 1986
1.169
+0.856
273.46%
jan 1, 1987
1.231
+0.062
5.31%
jan 1, 1988
1.255
+0.024
1.91%
jan 1, 1989
0.895
-0.36
-28.67%
jan 1, 1990
0.868
-0.027
-3.0%
jan 1, 1991
0.962
+0.093
10.74%
jan 1, 1992
0.948
-0.014
-1.41%
jan 1, 1993
1.002
+0.054
5.71%
jan 1, 1994
0.862
-0.14
-14.0%
jan 1, 1995
0.767
-0.095
-11.04%
jan 1, 2000
0.364
-0.403
-52.52%
jan 1, 2001
0.181
-0.183
-50.15%
jan 1, 2002
0.181
-0.001
-0.37%
jan 1, 2003
0.323
+0.143
78.84%
jan 1, 2004
0.312
-0.012
-3.63%
jan 1, 2005
0.403
+0.092
29.44%
jan 1, 2006
0.724
+0.321
79.57%
jan 1, 2007
0.824
+0.1
13.79%
jan 1, 2008
0.801
-0.023
-2.79%
jan 1, 2009
0.829
+0.028
3.48%
jan 1, 2010
0.96
+0.131
15.84%
jan 1, 2011
1.131
+0.171
17.78%
jan 1, 2012
0.985
-0.146
-12.92%
jan 1, 2013
0.928
-0.057
-5.78%
jan 1, 2014
0.589
-0.339
-36.49%
jan 1, 2015
0.839
+0.249
42.33%
Ranking of countries by current statistics by years


Comments: