29
/
en
AIzaSyAYiBZKx7MnpbEhh9jyipgxe19OcubqV5w
April 1, 2024
216821
Pakistan
PAK
true
2
1
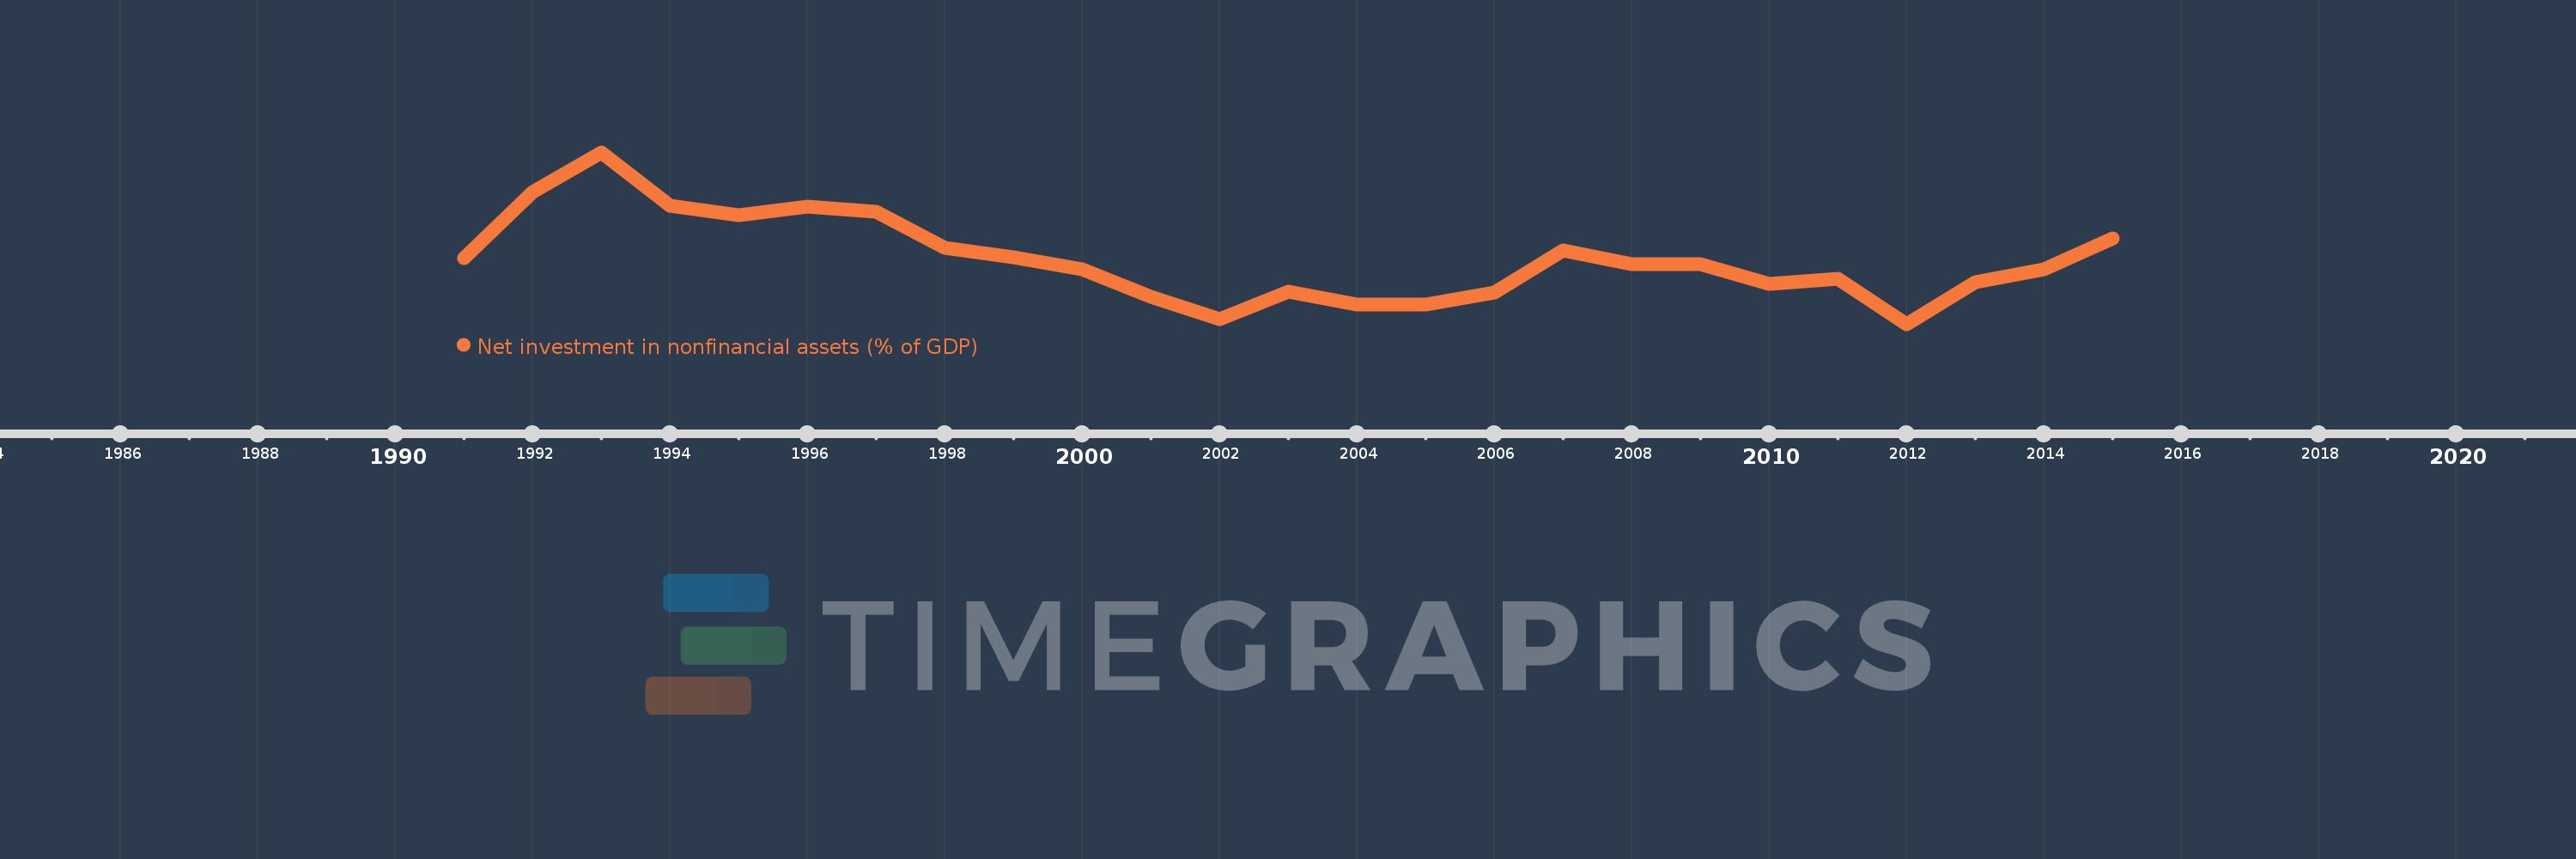
Net investment in nonfinancial assets (% of GDP)
2015,2014,2013,2012,2011,2010,2009,2008,2007,2006,2005,2004,2003,2002,2001,2000,1999,1998,1997,1996,1995,1994,1993,1992,1991
This statistics in other country:
AfghanistanAlbaniaAlgeriaAngolaAntigua and BarbudaArmeniaAustraliaAustriaAzerbaijanBahamas, TheBahrainBangladeshBarbadosBelarusBelgiumBelizeBhutanBoliviaBosnia and HerzegovinaBrazilBurundiCabo VerdeCambodiaCanadaCaribbean small statesCentral African RepublicCentral Europe and the BalticsChileChinaCongo, Dem. Rep.Congo, Rep.Costa RicaCote d'IvoireCroatiaCyprusCzech RepublicDenmarkDominicaDominican RepublicEarly-demographic dividendEast Asia & Pacific (excluding high income)East Asia & Pacific (IDA & IBRD countries)Egypt, Arab Rep.El SalvadorEquatorial GuineaEstoniaEthiopiaEuro areaEurope & Central AsiaEurope & Central Asia (excluding high income)Europe & Central Asia (IDA & IBRD countries)European UnionFijiFinlandFranceGambia, TheGeorgiaGermanyGreeceGuatemalaHigh incomeHondurasHungaryIBRD onlyIcelandIDA & IBRD totalIDA blendIndiaIndonesiaIran, Islamic Rep.IraqIrelandIsraelItalyJamaicaKazakhstanKiribatiKorea, Rep.Kyrgyz RepublicLao PDRLate-demographic dividendLatin America & Caribbean Latin America & Caribbean (excluding high income)Latin America & the Caribbean (IDA & IBRD countries)LatviaLebanonLithuaniaLow & middle incomeLower middle incomeLuxembourgMacao SAR, ChinaMacedonia, FYRMadagascarMalawiMaldivesMaliMaltaMauritiusMexicoMicronesia, Fed. Sts.Middle East & North Africa (excluding high income)Middle East & North Africa (IDA & IBRD countries)Middle incomeMoldovaMongoliaMoroccoMozambiqueNamibiaNepalNetherlandsNew ZealandNicaraguaNigeriaNorth AmericaNorwayOECD membersOmanOther small statesPacific island small statesPakistanParaguayPeruPhilippinesPolandPortugalPost-demographic dividendQatarRomaniaRussian FederationRwandaSamoaSan MarinoSao Tome and PrincipeSenegalSerbiaSierra LeoneSingaporeSlovak RepublicSmall statesSolomon IslandsSouth AfricaSouth AsiaSouth Asia (IDA & IBRD)SpainSri LankaSub-Saharan Africa Sub-Saharan Africa (excluding high income)Sub-Saharan Africa (IDA & IBRD countries)SurinameSwazilandSwedenSwitzerlandSyrian Arab RepublicThailandTimor-LesteTrinidad and TobagoTurkeyUgandaUkraineUnited Arab EmiratesUnited KingdomUnited StatesUpper middle incomeUruguayVanuatuVietnamWest Bank and GazaWorldYemen, Rep.Zimbabwe Timeline:
This timeline shows a graph from 1991 to 2015 of Pakistan. No data until 1990. Number of actual observations by date: 25.
Source name:
World Development Indicators
Source organization:
International Monetary Fund, Government Finance Statistics Yearbook and data files.
Categories, topics:
Public Sector
Last updated:
apr 23, 2017
Indicators value changes by year
At the date of observation
Value
Absolute change
Change from previous value
jan 1, 1991
2.593
+2.593
0.0%
jan 1, 1992
3.98
+1.387
53.48%
jan 1, 1993
4.801
+0.821
20.64%
jan 1, 1994
3.694
-1.107
-23.05%
jan 1, 1995
3.494
-0.2
-5.42%
jan 1, 1996
3.666
+0.172
4.93%
jan 1, 1997
3.562
-0.105
-2.85%
jan 1, 1998
2.805
-0.757
-21.25%
jan 1, 1999
2.605
-0.199
-7.1%
jan 1, 2000
2.349
-0.256
-9.84%
jan 1, 2001
1.778
-0.571
-24.29%
jan 1, 2002
1.315
-0.463
-26.04%
jan 1, 2003
1.881
+0.566
43.05%
jan 1, 2004
1.622
-0.259
-13.79%
jan 1, 2005
1.62
-0.002
-0.14%
jan 1, 2006
1.863
+0.243
15.02%
jan 1, 2007
2.754
+0.891
47.84%
jan 1, 2008
2.46
-0.295
-10.7%
jan 1, 2009
2.458
-0.002
-0.08%
jan 1, 2010
2.056
-0.402
-16.35%
jan 1, 2011
2.15
+0.094
4.59%
jan 1, 2012
1.207
-0.943
-43.85%
jan 1, 2013
2.089
+0.882
73.04%
jan 1, 2014
2.353
+0.264
12.61%
jan 1, 2015
3.002
+0.649
27.56%
Ranking of countries by current statistics by years


Comments: