29
/
en
AIzaSyAYiBZKx7MnpbEhh9jyipgxe19OcubqV5w
April 1, 2024
112642
Costa Rica
CRI
true
2
1
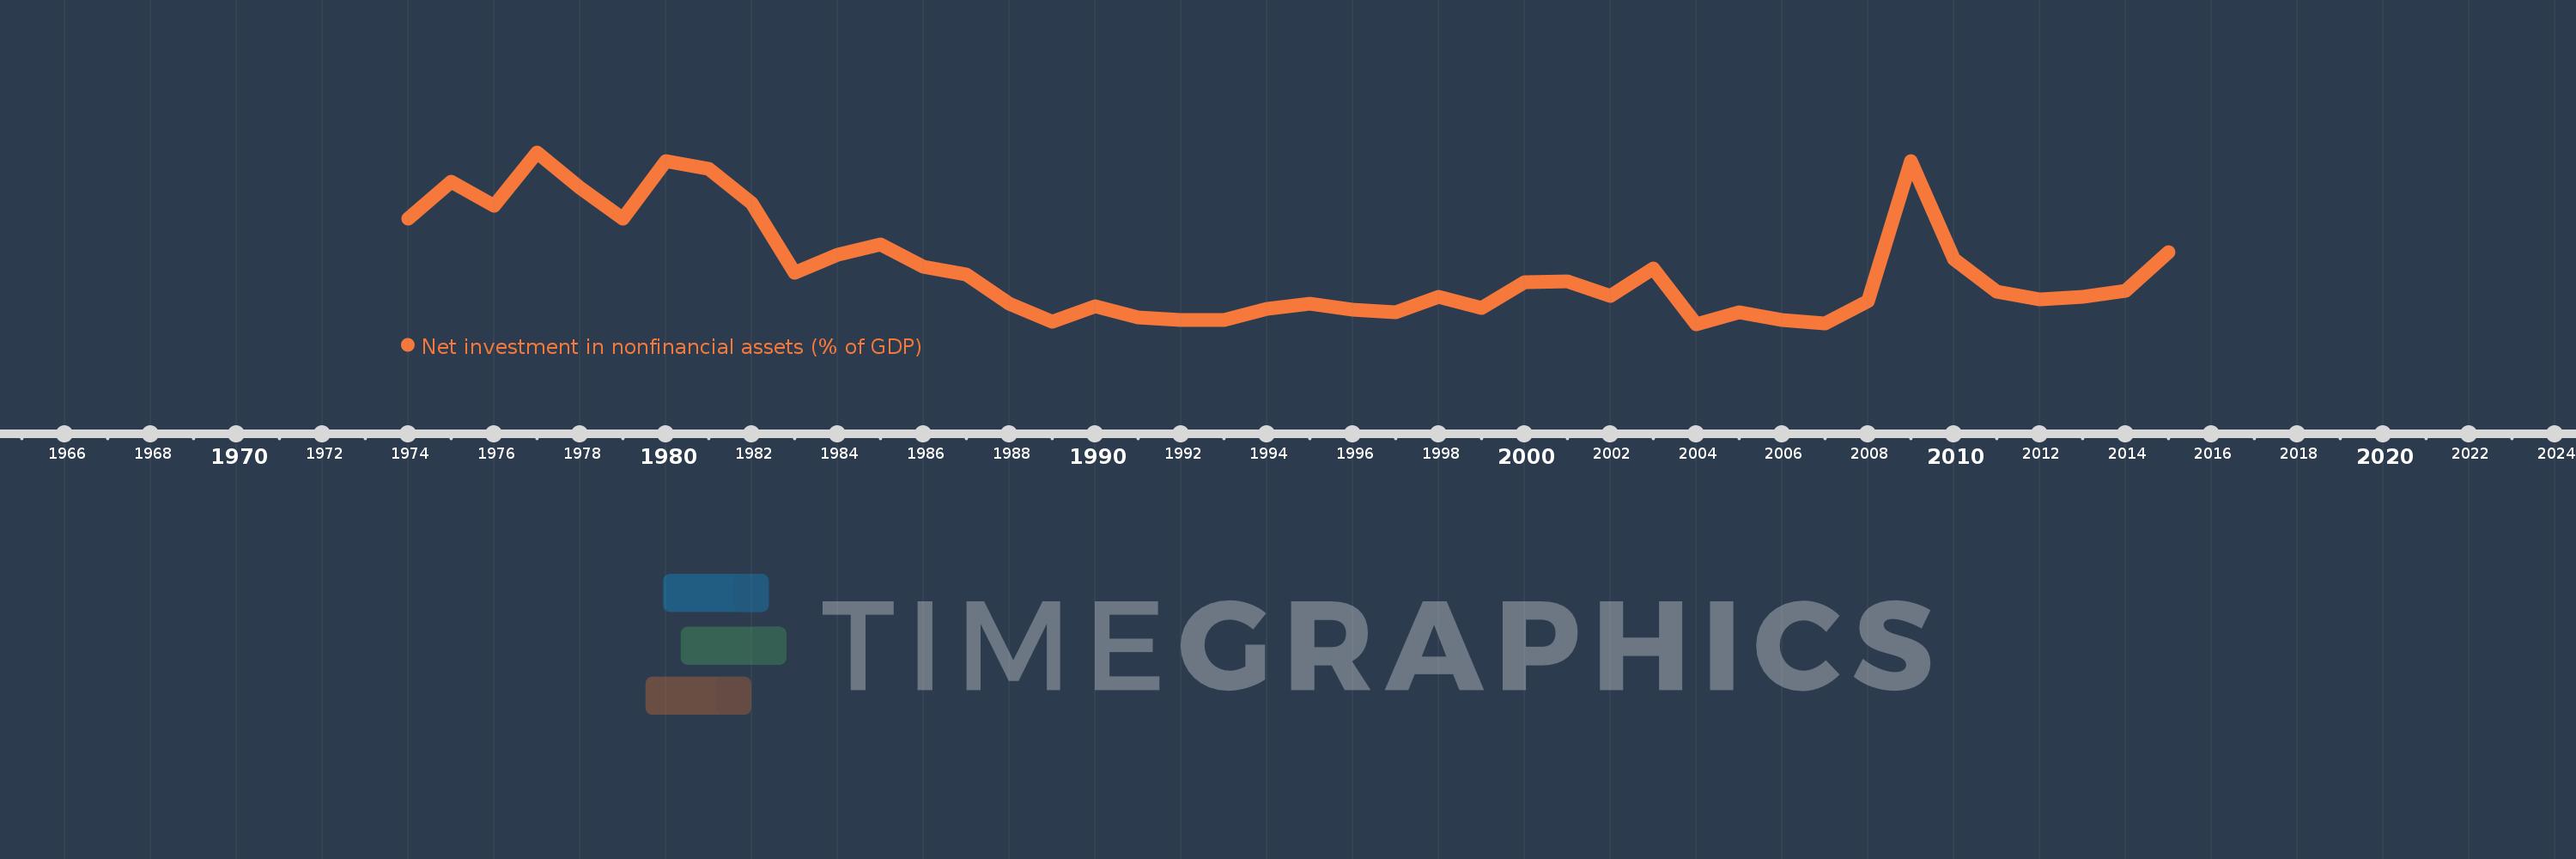
Net investment in nonfinancial assets (% of GDP)
2015,2014,2013,2012,2011,2010,2009,2008,2007,2006,2005,2004,2003,2002,2001,2000,1999,1998,1997,1996,1995,1994,1993,1992,1991,1990,1989,1988,1987,1986,1985,1984,1983,1982,1981,1980,1979,1978,1977,1976,1975,1974
This statistics in other country:
AfghanistanAlbaniaAlgeriaAngolaAntigua and BarbudaArmeniaAustraliaAustriaAzerbaijanBahamas, TheBahrainBangladeshBarbadosBelarusBelgiumBelizeBhutanBoliviaBosnia and HerzegovinaBrazilBurundiCabo VerdeCambodiaCanadaCaribbean small statesCentral African RepublicCentral Europe and the BalticsChileChinaCongo, Dem. Rep.Congo, Rep.Costa RicaCote d'IvoireCroatiaCyprusCzech RepublicDenmarkDominicaDominican RepublicEarly-demographic dividendEast Asia & Pacific (excluding high income)East Asia & Pacific (IDA & IBRD countries)Egypt, Arab Rep.El SalvadorEquatorial GuineaEstoniaEthiopiaEuro areaEurope & Central AsiaEurope & Central Asia (excluding high income)Europe & Central Asia (IDA & IBRD countries)European UnionFijiFinlandFranceGambia, TheGeorgiaGermanyGreeceGuatemalaHigh incomeHondurasHungaryIBRD onlyIcelandIDA & IBRD totalIDA blendIndiaIndonesiaIran, Islamic Rep.IraqIrelandIsraelItalyJamaicaKazakhstanKiribatiKorea, Rep.Kyrgyz RepublicLao PDRLate-demographic dividendLatin America & Caribbean Latin America & Caribbean (excluding high income)Latin America & the Caribbean (IDA & IBRD countries)LatviaLebanonLithuaniaLow & middle incomeLower middle incomeLuxembourgMacao SAR, ChinaMacedonia, FYRMadagascarMalawiMaldivesMaliMaltaMauritiusMexicoMicronesia, Fed. Sts.Middle East & North Africa (excluding high income)Middle East & North Africa (IDA & IBRD countries)Middle incomeMoldovaMongoliaMoroccoMozambiqueNamibiaNepalNetherlandsNew ZealandNicaraguaNigeriaNorth AmericaNorwayOECD membersOmanOther small statesPacific island small statesPakistanParaguayPeruPhilippinesPolandPortugalPost-demographic dividendQatarRomaniaRussian FederationRwandaSamoaSan MarinoSao Tome and PrincipeSenegalSerbiaSierra LeoneSingaporeSlovak RepublicSmall statesSolomon IslandsSouth AfricaSouth AsiaSouth Asia (IDA & IBRD)SpainSri LankaSub-Saharan Africa Sub-Saharan Africa (excluding high income)Sub-Saharan Africa (IDA & IBRD countries)SurinameSwazilandSwedenSwitzerlandSyrian Arab RepublicThailandTimor-LesteTrinidad and TobagoTurkeyUgandaUkraineUnited Arab EmiratesUnited KingdomUnited StatesUpper middle incomeUruguayVanuatuVietnamWest Bank and GazaWorldYemen, Rep.Zimbabwe Timeline:
This timeline shows a graph from 1974 to 2015 of Costa Rica. No data until 1973. Number of actual observations by date: 42.
Source name:
World Development Indicators
Source organization:
International Monetary Fund, Government Finance Statistics Yearbook and data files.
Categories, topics:
Public Sector
Last updated:
apr 23, 2017
Indicators value changes by year
At the date of observation
Value
Absolute change
Change from previous value
jan 1, 1974
2.657
+2.657
0.0%
jan 1, 1975
3.254
+0.597
22.46%
jan 1, 1976
2.856
-0.397
-12.21%
jan 1, 1977
3.724
+0.868
30.38%
jan 1, 1978
3.152
-0.572
-15.36%
jan 1, 1979
2.65
-0.503
-15.95%
jan 1, 1980
3.585
+0.936
35.32%
jan 1, 1981
3.454
-0.132
-3.68%
jan 1, 1982
2.907
-0.547
-15.83%
jan 1, 1983
1.774
-1.133
-38.97%
jan 1, 1984
2.062
+0.288
16.23%
jan 1, 1985
2.229
+0.167
8.08%
jan 1, 1986
1.87
-0.359
-16.1%
jan 1, 1987
1.74
-0.13
-6.93%
jan 1, 1988
1.274
-0.467
-26.82%
jan 1, 1989
0.984
-0.29
-22.78%
jan 1, 1990
1.232
+0.248
25.24%
jan 1, 1991
1.049
-0.183
-14.83%
jan 1, 1992
1.005
-0.044
-4.21%
jan 1, 1993
1.007
+0.002
0.19%
jan 1, 1994
1.19
+0.183
18.15%
jan 1, 1995
1.268
+0.079
6.6%
jan 1, 1996
1.171
-0.098
-7.69%
jan 1, 1997
1.135
-0.036
-3.04%
jan 1, 1998
1.391
+0.256
22.55%
jan 1, 1999
1.202
-0.189
-13.6%
jan 1, 2000
1.626
+0.424
35.3%
jan 1, 2001
1.63
+0.004
0.25%
jan 1, 2002
1.395
-0.235
-14.43%
jan 1, 2003
1.848
+0.453
32.45%
jan 1, 2004
0.941
-0.907
-49.07%
jan 1, 2005
1.133
+0.192
20.45%
jan 1, 2006
1.009
-0.125
-11.01%
jan 1, 2007
0.951
-0.058
-5.7%
jan 1, 2008
1.317
+0.366
38.43%
jan 1, 2009
3.584
+2.267
172.2%
jan 1, 2010
2.004
-1.579
-44.07%
jan 1, 2011
1.475
-0.529
-26.39%
jan 1, 2012
1.34
-0.135
-9.18%
jan 1, 2013
1.383
+0.044
3.25%
jan 1, 2014
1.479
+0.095
6.88%
jan 1, 2015
2.115
+0.637
43.06%
Ranking of countries by current statistics by years


Comments: