29
/
en
AIzaSyAYiBZKx7MnpbEhh9jyipgxe19OcubqV5w
April 1, 2024
222585
Peru
PER
true
2
1
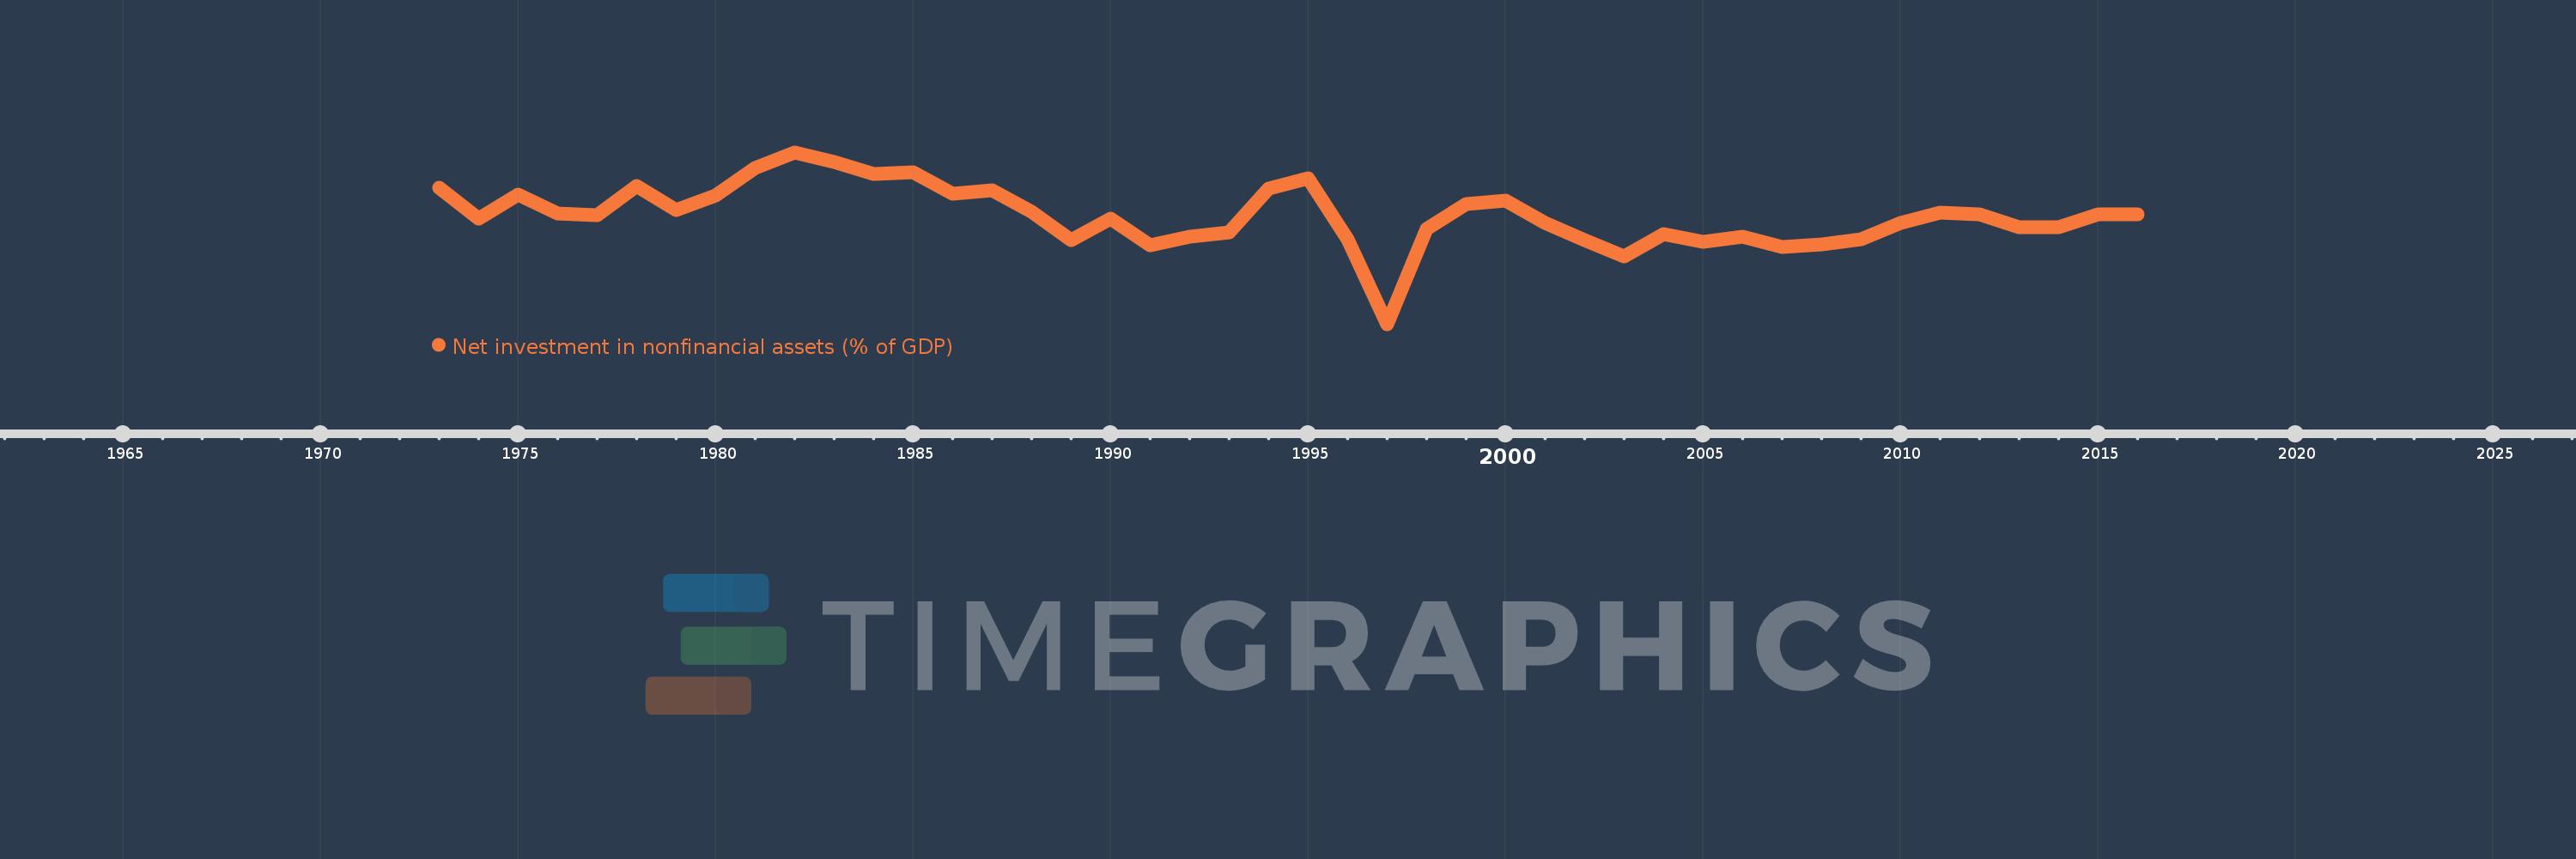
Net investment in nonfinancial assets (% of GDP)
2016,2015,2014,2013,2012,2011,2010,2009,2008,2007,2006,2005,2004,2003,2002,2001,2000,1999,1998,1997,1996,1995,1994,1993,1992,1991,1990,1989,1988,1987,1986,1985,1984,1983,1982,1981,1980,1979,1978,1977,1976,1975,1974,1973
This statistics in other country:
AfghanistanAlbaniaAlgeriaAngolaAntigua and BarbudaArmeniaAustraliaAustriaAzerbaijanBahamas, TheBahrainBangladeshBarbadosBelarusBelgiumBelizeBhutanBoliviaBosnia and HerzegovinaBrazilBurundiCabo VerdeCambodiaCanadaCaribbean small statesCentral African RepublicCentral Europe and the BalticsChileChinaCongo, Dem. Rep.Congo, Rep.Costa RicaCote d'IvoireCroatiaCyprusCzech RepublicDenmarkDominicaDominican RepublicEarly-demographic dividendEast Asia & Pacific (excluding high income)East Asia & Pacific (IDA & IBRD countries)Egypt, Arab Rep.El SalvadorEquatorial GuineaEstoniaEthiopiaEuro areaEurope & Central AsiaEurope & Central Asia (excluding high income)Europe & Central Asia (IDA & IBRD countries)European UnionFijiFinlandFranceGambia, TheGeorgiaGermanyGreeceGuatemalaHigh incomeHondurasHungaryIBRD onlyIcelandIDA & IBRD totalIDA blendIndiaIndonesiaIran, Islamic Rep.IraqIrelandIsraelItalyJamaicaKazakhstanKiribatiKorea, Rep.Kyrgyz RepublicLao PDRLate-demographic dividendLatin America & Caribbean Latin America & Caribbean (excluding high income)Latin America & the Caribbean (IDA & IBRD countries)LatviaLebanonLithuaniaLow & middle incomeLower middle incomeLuxembourgMacao SAR, ChinaMacedonia, FYRMadagascarMalawiMaldivesMaliMaltaMauritiusMexicoMicronesia, Fed. Sts.Middle East & North Africa (excluding high income)Middle East & North Africa (IDA & IBRD countries)Middle incomeMoldovaMongoliaMoroccoMozambiqueNamibiaNepalNetherlandsNew ZealandNicaraguaNigeriaNorth AmericaNorwayOECD membersOmanOther small statesPacific island small statesPakistanParaguayPeruPhilippinesPolandPortugalPost-demographic dividendQatarRomaniaRussian FederationRwandaSamoaSan MarinoSao Tome and PrincipeSenegalSerbiaSierra LeoneSingaporeSlovak RepublicSmall statesSolomon IslandsSouth AfricaSouth AsiaSouth Asia (IDA & IBRD)SpainSri LankaSub-Saharan Africa Sub-Saharan Africa (excluding high income)Sub-Saharan Africa (IDA & IBRD countries)SurinameSwazilandSwedenSwitzerlandSyrian Arab RepublicThailandTimor-LesteTrinidad and TobagoTurkeyUgandaUkraineUnited Arab EmiratesUnited KingdomUnited StatesUpper middle incomeUruguayVanuatuVietnamWest Bank and GazaWorldYemen, Rep.Zimbabwe Timeline:
This timeline shows a graph from 1973 to 2016 of Peru. No data until 1972. Number of actual observations by date: 44.
Source name:
World Development Indicators
Source organization:
International Monetary Fund, Government Finance Statistics Yearbook and data files.
Categories, topics:
Public Sector
Last updated:
apr 23, 2017
Indicators value changes by year
Minimum:
-1.262
jan 1, 1997
At the date of observation
Value
Absolute change
Change from previous value
jan 1, 1973
2.812
+2.812
0.0%
jan 1, 1974
1.88
-0.932
-33.13%
jan 1, 1975
2.61
+0.73
38.83%
jan 1, 1976
2.048
-0.562
-21.54%
jan 1, 1977
2.001
-0.047
-2.29%
jan 1, 1978
2.857
+0.855
42.75%
jan 1, 1979
2.15
-0.706
-24.72%
jan 1, 1980
2.566
+0.416
19.33%
jan 1, 1981
3.398
+0.832
32.4%
jan 1, 1982
3.861
+0.463
13.64%
jan 1, 1983
3.572
-0.289
-7.5%
jan 1, 1984
3.221
-0.35
-9.81%
jan 1, 1985
3.26
+0.038
1.19%
jan 1, 1986
2.621
-0.639
-19.6%
jan 1, 1987
2.719
+0.098
3.74%
jan 1, 1988
2.087
-0.632
-23.25%
jan 1, 1989
1.244
-0.843
-40.4%
jan 1, 1990
1.898
+0.655
52.65%
jan 1, 1991
1.089
-0.81
-42.66%
jan 1, 1992
1.342
+0.254
23.3%
jan 1, 1993
1.483
+0.141
10.47%
jan 1, 1994
2.791
+1.309
88.26%
jan 1, 1995
3.092
+0.301
10.77%
jan 1, 1996
1.277
-1.815
-58.69%
jan 1, 1997
-1.262
-2.539
-198.78%
jan 1, 1998
1.588
+2.85
-225.87%
jan 1, 1999
2.332
+0.743
46.8%
jan 1, 2000
2.414
+0.082
3.51%
jan 1, 2001
1.761
-0.652
-27.02%
jan 1, 2002
1.233
-0.529
-30.01%
jan 1, 2003
0.756
-0.477
-38.7%
jan 1, 2004
1.437
+0.681
90.14%
jan 1, 2005
1.184
-0.253
-17.6%
jan 1, 2006
1.342
+0.158
13.36%
jan 1, 2007
1.049
-0.293
-21.82%
jan 1, 2008
1.124
+0.075
7.12%
jan 1, 2009
1.279
+0.155
13.82%
jan 1, 2010
1.749
+0.47
36.71%
jan 1, 2011
2.066
+0.317
18.13%
jan 1, 2012
2.015
-0.051
-2.48%
jan 1, 2013
1.642
-0.373
-18.5%
jan 1, 2014
1.618
-0.024
-1.48%
jan 1, 2015
2.003
+0.385
23.8%
jan 1, 2016
2.013
+0.01
0.49%
Ranking of countries by current statistics by years


Comments: