29
/
en
AIzaSyAYiBZKx7MnpbEhh9jyipgxe19OcubqV5w
April 1, 2024
134417
France
FRA
true
2
1
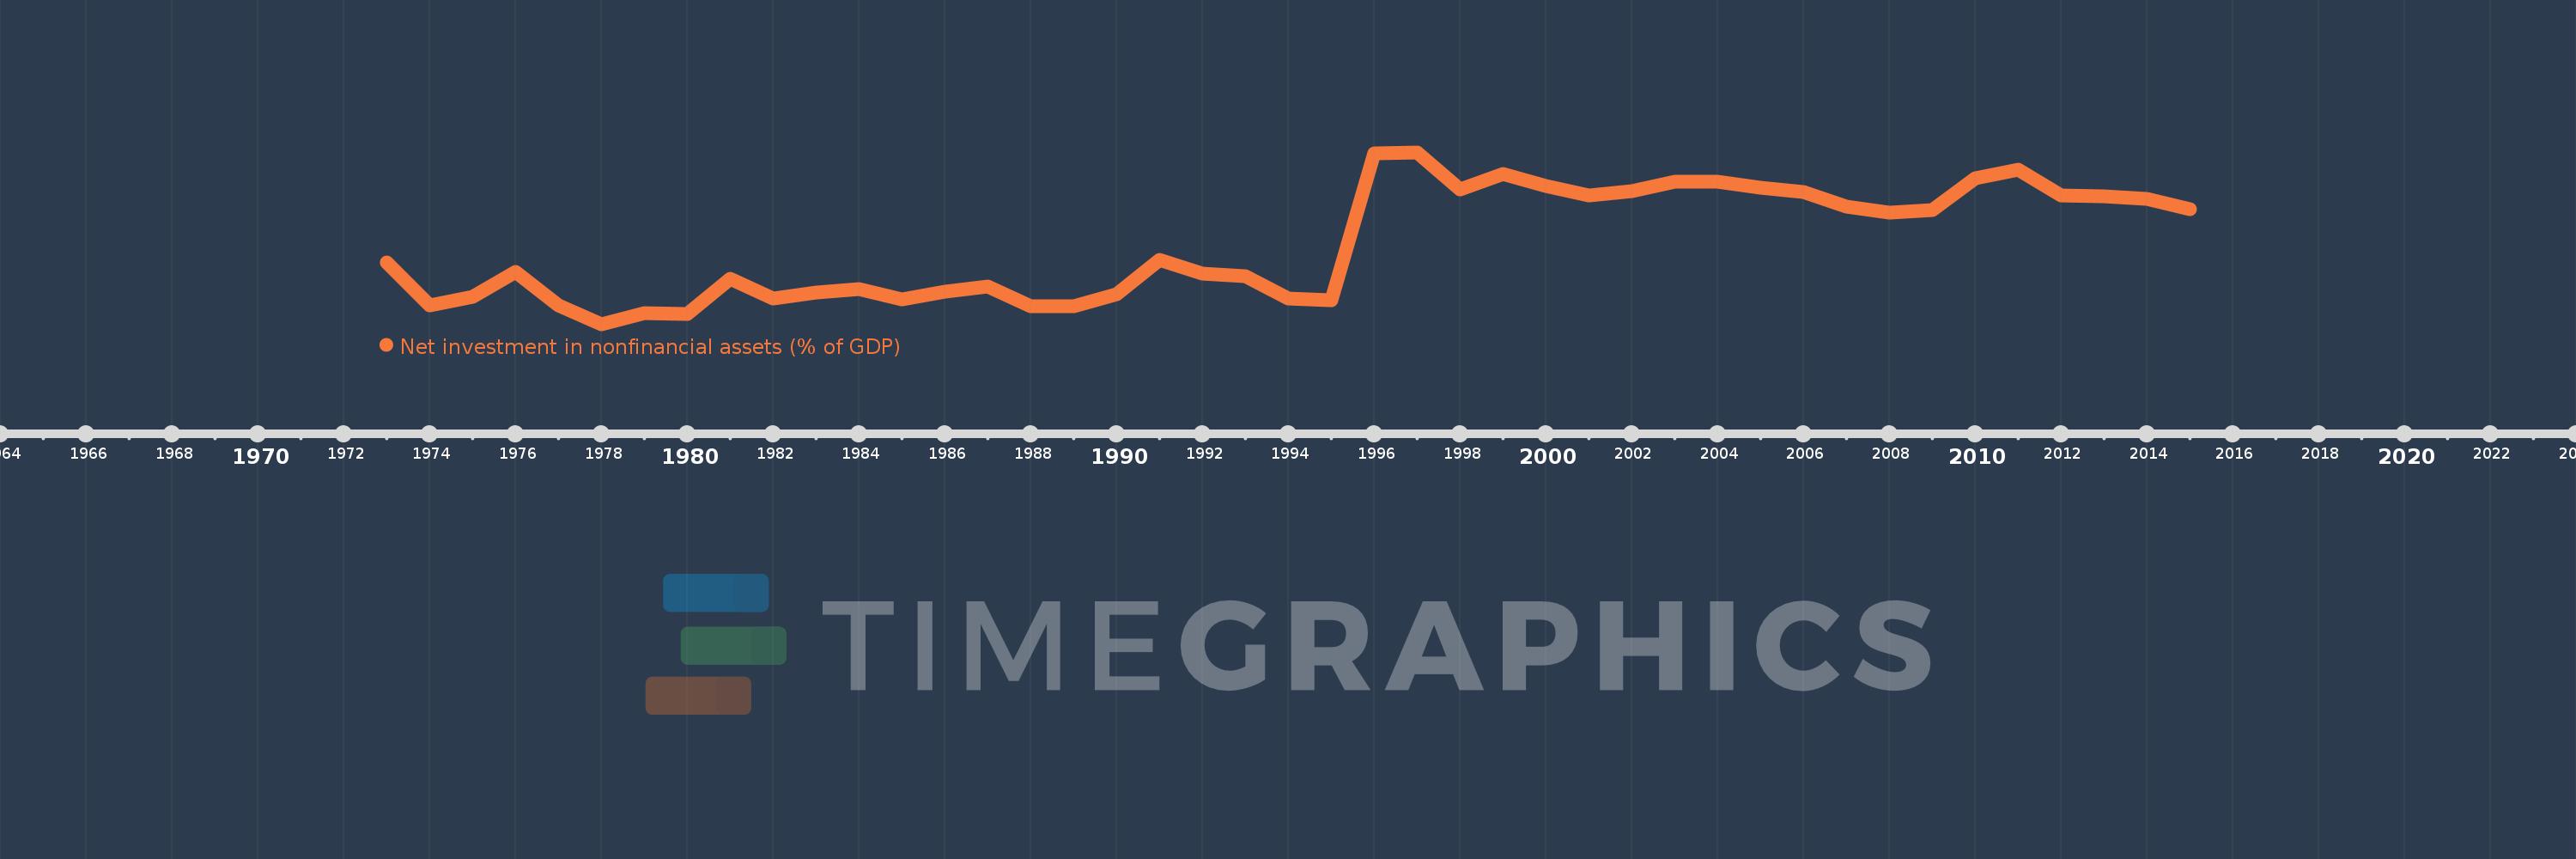
Net investment in nonfinancial assets (% of GDP)
2015,2014,2013,2012,2011,2010,2009,2008,2007,2006,2005,2004,2003,2002,2001,2000,1999,1998,1997,1996,1995,1994,1993,1992,1991,1990,1989,1988,1987,1986,1985,1984,1983,1982,1981,1980,1979,1978,1977,1976,1975,1974,1973
This statistics in other country:
AfghanistanAlbaniaAlgeriaAngolaAntigua and BarbudaArmeniaAustraliaAustriaAzerbaijanBahamas, TheBahrainBangladeshBarbadosBelarusBelgiumBelizeBhutanBoliviaBosnia and HerzegovinaBrazilBurundiCabo VerdeCambodiaCanadaCaribbean small statesCentral African RepublicCentral Europe and the BalticsChileChinaCongo, Dem. Rep.Congo, Rep.Costa RicaCote d'IvoireCroatiaCyprusCzech RepublicDenmarkDominicaDominican RepublicEarly-demographic dividendEast Asia & Pacific (excluding high income)East Asia & Pacific (IDA & IBRD countries)Egypt, Arab Rep.El SalvadorEquatorial GuineaEstoniaEthiopiaEuro areaEurope & Central AsiaEurope & Central Asia (excluding high income)Europe & Central Asia (IDA & IBRD countries)European UnionFijiFinlandFranceGambia, TheGeorgiaGermanyGreeceGuatemalaHigh incomeHondurasHungaryIBRD onlyIcelandIDA & IBRD totalIDA blendIndiaIndonesiaIran, Islamic Rep.IraqIrelandIsraelItalyJamaicaKazakhstanKiribatiKorea, Rep.Kyrgyz RepublicLao PDRLate-demographic dividendLatin America & Caribbean Latin America & Caribbean (excluding high income)Latin America & the Caribbean (IDA & IBRD countries)LatviaLebanonLithuaniaLow & middle incomeLower middle incomeLuxembourgMacao SAR, ChinaMacedonia, FYRMadagascarMalawiMaldivesMaliMaltaMauritiusMexicoMicronesia, Fed. Sts.Middle East & North Africa (excluding high income)Middle East & North Africa (IDA & IBRD countries)Middle incomeMoldovaMongoliaMoroccoMozambiqueNamibiaNepalNetherlandsNew ZealandNicaraguaNigeriaNorth AmericaNorwayOECD membersOmanOther small statesPacific island small statesPakistanParaguayPeruPhilippinesPolandPortugalPost-demographic dividendQatarRomaniaRussian FederationRwandaSamoaSan MarinoSao Tome and PrincipeSenegalSerbiaSierra LeoneSingaporeSlovak RepublicSmall statesSolomon IslandsSouth AfricaSouth AsiaSouth Asia (IDA & IBRD)SpainSri LankaSub-Saharan Africa Sub-Saharan Africa (excluding high income)Sub-Saharan Africa (IDA & IBRD countries)SurinameSwazilandSwedenSwitzerlandSyrian Arab RepublicThailandTimor-LesteTrinidad and TobagoTurkeyUgandaUkraineUnited Arab EmiratesUnited KingdomUnited StatesUpper middle incomeUruguayVanuatuVietnamWest Bank and GazaWorldYemen, Rep.Zimbabwe Timeline:
This timeline shows a graph from 1973 to 2015 of France. No data until 1972. Number of actual observations by date: 43.
Source name:
World Development Indicators
Source organization:
International Monetary Fund, Government Finance Statistics Yearbook and data files.
Categories, topics:
Public Sector
Last updated:
apr 23, 2017
Indicators value changes by year
At the date of observation
Value
Absolute change
Change from previous value
jan 1, 1973
1.106
+1.106
0.0%
jan 1, 1974
0.728
-0.378
-34.21%
jan 1, 1975
0.805
+0.078
10.68%
jan 1, 1976
1.024
+0.219
27.17%
jan 1, 1977
0.73
-0.294
-28.69%
jan 1, 1978
0.565
-0.166
-22.67%
jan 1, 1979
0.663
+0.098
17.34%
jan 1, 1980
0.656
-0.006
-0.95%
jan 1, 1981
0.962
+0.306
46.55%
jan 1, 1982
0.79
-0.172
-17.93%
jan 1, 1983
0.845
+0.056
7.06%
jan 1, 1984
0.876
+0.03
3.6%
jan 1, 1985
0.782
-0.094
-10.71%
jan 1, 1986
0.85
+0.068
8.69%
jan 1, 1987
0.895
+0.045
5.27%
jan 1, 1988
0.719
-0.176
-19.64%
jan 1, 1989
0.725
+0.006
0.83%
jan 1, 1990
0.828
+0.103
14.18%
jan 1, 1991
1.128
+0.3
36.22%
jan 1, 1992
1.007
-0.12
-10.66%
jan 1, 1993
0.984
-0.023
-2.3%
jan 1, 1994
0.79
-0.194
-19.75%
jan 1, 1995
0.776
-0.014
-1.73%
jan 1, 1996
2.063
+1.287
165.81%
jan 1, 1997
2.07
+0.006
0.31%
jan 1, 1998
1.742
-0.328
-15.83%
jan 1, 1999
1.882
+0.14
8.01%
jan 1, 2000
1.777
-0.104
-5.53%
jan 1, 2001
1.695
-0.082
-4.62%
jan 1, 2002
1.734
+0.039
2.3%
jan 1, 2003
1.814
+0.08
4.62%
jan 1, 2004
1.812
-0.002
-0.12%
jan 1, 2005
1.76
-0.052
-2.87%
jan 1, 2006
1.721
-0.04
-2.25%
jan 1, 2007
1.595
-0.126
-7.32%
jan 1, 2008
1.542
-0.053
-3.3%
jan 1, 2009
1.565
+0.022
1.45%
jan 1, 2010
1.843
+0.278
17.77%
jan 1, 2011
1.918
+0.075
4.09%
jan 1, 2012
1.696
-0.222
-11.58%
jan 1, 2013
1.684
-0.012
-0.7%
jan 1, 2014
1.662
-0.022
-1.3%
jan 1, 2015
1.573
-0.09
-5.39%
Ranking of countries by current statistics by years


Comments: