29
/
en
AIzaSyAYiBZKx7MnpbEhh9jyipgxe19OcubqV5w
April 1, 2024
155003
India
IND
true
2
1
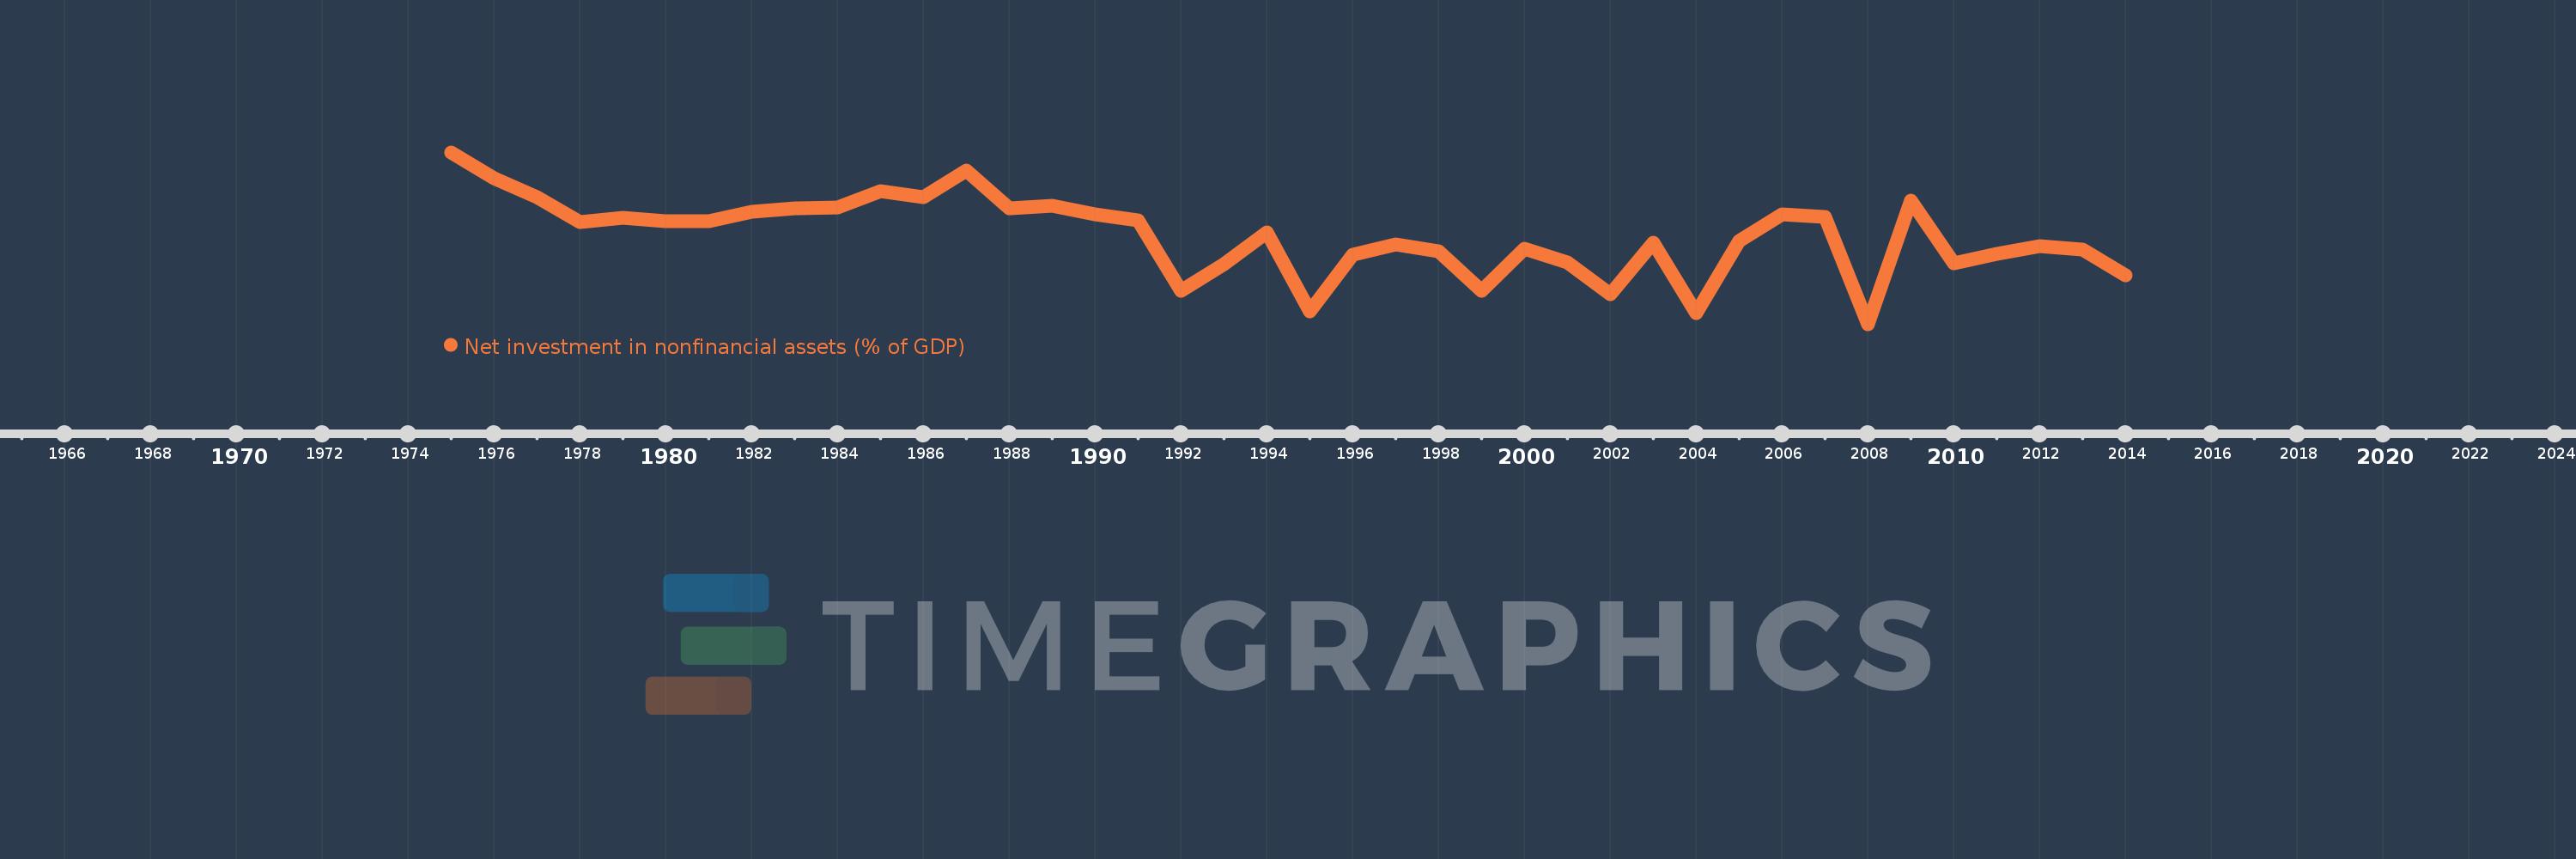
Net investment in nonfinancial assets (% of GDP)
2014,2013,2012,2011,2010,2009,2008,2007,2006,2005,2004,2003,2002,2001,2000,1999,1998,1997,1996,1995,1994,1993,1992,1991,1990,1989,1988,1987,1986,1985,1984,1983,1982,1981,1980,1979,1978,1977,1976,1975
This statistics in other country:
AfghanistanAlbaniaAlgeriaAngolaAntigua and BarbudaArmeniaAustraliaAustriaAzerbaijanBahamas, TheBahrainBangladeshBarbadosBelarusBelgiumBelizeBhutanBoliviaBosnia and HerzegovinaBrazilBurundiCabo VerdeCambodiaCanadaCaribbean small statesCentral African RepublicCentral Europe and the BalticsChileChinaCongo, Dem. Rep.Congo, Rep.Costa RicaCote d'IvoireCroatiaCyprusCzech RepublicDenmarkDominicaDominican RepublicEarly-demographic dividendEast Asia & Pacific (excluding high income)East Asia & Pacific (IDA & IBRD countries)Egypt, Arab Rep.El SalvadorEquatorial GuineaEstoniaEthiopiaEuro areaEurope & Central AsiaEurope & Central Asia (excluding high income)Europe & Central Asia (IDA & IBRD countries)European UnionFijiFinlandFranceGambia, TheGeorgiaGermanyGreeceGuatemalaHigh incomeHondurasHungaryIBRD onlyIcelandIDA & IBRD totalIDA blendIndiaIndonesiaIran, Islamic Rep.IraqIrelandIsraelItalyJamaicaKazakhstanKiribatiKorea, Rep.Kyrgyz RepublicLao PDRLate-demographic dividendLatin America & Caribbean Latin America & Caribbean (excluding high income)Latin America & the Caribbean (IDA & IBRD countries)LatviaLebanonLithuaniaLow & middle incomeLower middle incomeLuxembourgMacao SAR, ChinaMacedonia, FYRMadagascarMalawiMaldivesMaliMaltaMauritiusMexicoMicronesia, Fed. Sts.Middle East & North Africa (excluding high income)Middle East & North Africa (IDA & IBRD countries)Middle incomeMoldovaMongoliaMoroccoMozambiqueNamibiaNepalNetherlandsNew ZealandNicaraguaNigeriaNorth AmericaNorwayOECD membersOmanOther small statesPacific island small statesPakistanParaguayPeruPhilippinesPolandPortugalPost-demographic dividendQatarRomaniaRussian FederationRwandaSamoaSan MarinoSao Tome and PrincipeSenegalSerbiaSierra LeoneSingaporeSlovak RepublicSmall statesSolomon IslandsSouth AfricaSouth AsiaSouth Asia (IDA & IBRD)SpainSri LankaSub-Saharan Africa Sub-Saharan Africa (excluding high income)Sub-Saharan Africa (IDA & IBRD countries)SurinameSwazilandSwedenSwitzerlandSyrian Arab RepublicThailandTimor-LesteTrinidad and TobagoTurkeyUgandaUkraineUnited Arab EmiratesUnited KingdomUnited StatesUpper middle incomeUruguayVanuatuVietnamWest Bank and GazaWorldYemen, Rep.Zimbabwe Timeline:
This timeline shows a graph from 1975 to 2014 of India. No data until 1974. Number of actual observations by date: 40.
Source name:
World Development Indicators
Source organization:
International Monetary Fund, Government Finance Statistics Yearbook and data files.
Categories, topics:
Public Sector
Last updated:
apr 23, 2017
Indicators value changes by year
Minimum:
-0.287
jan 1, 2008
At the date of observation
Value
Absolute change
Change from previous value
jan 1, 1975
0.89
+0.89
0.0%
jan 1, 1976
0.714
-0.176
-19.8%
jan 1, 1977
0.582
-0.132
-18.43%
jan 1, 1978
0.413
-0.169
-29.1%
jan 1, 1979
0.444
+0.031
7.54%
jan 1, 1980
0.419
-0.025
-5.59%
jan 1, 1981
0.416
-0.003
-0.67%
jan 1, 1982
0.481
+0.064
15.45%
jan 1, 1983
0.508
+0.027
5.7%
jan 1, 1984
0.514
+0.006
1.25%
jan 1, 1985
0.624
+0.109
21.22%
jan 1, 1986
0.581
-0.043
-6.83%
jan 1, 1987
0.764
+0.183
31.56%
jan 1, 1988
0.506
-0.259
-33.84%
jan 1, 1989
0.523
+0.017
3.43%
jan 1, 1990
0.463
-0.06
-11.55%
jan 1, 1991
0.422
-0.04
-8.7%
jan 1, 1992
-0.061
-0.483
-114.33%
jan 1, 1993
0.127
+0.188
-309.83%
jan 1, 1994
0.342
+0.215
169.34%
jan 1, 1995
-0.202
-0.545
-159.17%
jan 1, 1996
0.19
+0.393
-193.89%
jan 1, 1997
0.257
+0.067
35.21%
jan 1, 1998
0.215
-0.042
-16.34%
jan 1, 1999
-0.058
-0.273
-126.82%
jan 1, 2000
0.232
+0.29
-502.15%
jan 1, 2001
0.139
-0.093
-40.1%
jan 1, 2002
-0.08
-0.219
-157.9%
jan 1, 2003
0.273
+0.353
-439.38%
jan 1, 2004
-0.213
-0.486
-178.16%
jan 1, 2005
0.281
+0.494
-231.73%
jan 1, 2006
0.468
+0.187
66.48%
jan 1, 2007
0.447
-0.021
-4.56%
jan 1, 2008
-0.287
-0.734
-164.33%
jan 1, 2009
0.561
+0.848
-295.25%
jan 1, 2010
0.133
-0.428
-76.28%
jan 1, 2011
0.196
+0.063
47.52%
jan 1, 2012
0.247
+0.05
25.62%
jan 1, 2013
0.227
-0.02
-8.14%
jan 1, 2014
0.049
-0.178
-78.44%
Ranking of countries by current statistics by years


Comments: