29
/
en
AIzaSyAYiBZKx7MnpbEhh9jyipgxe19OcubqV5w
April 1, 2024
262650
Thailand
THA
true
2
1
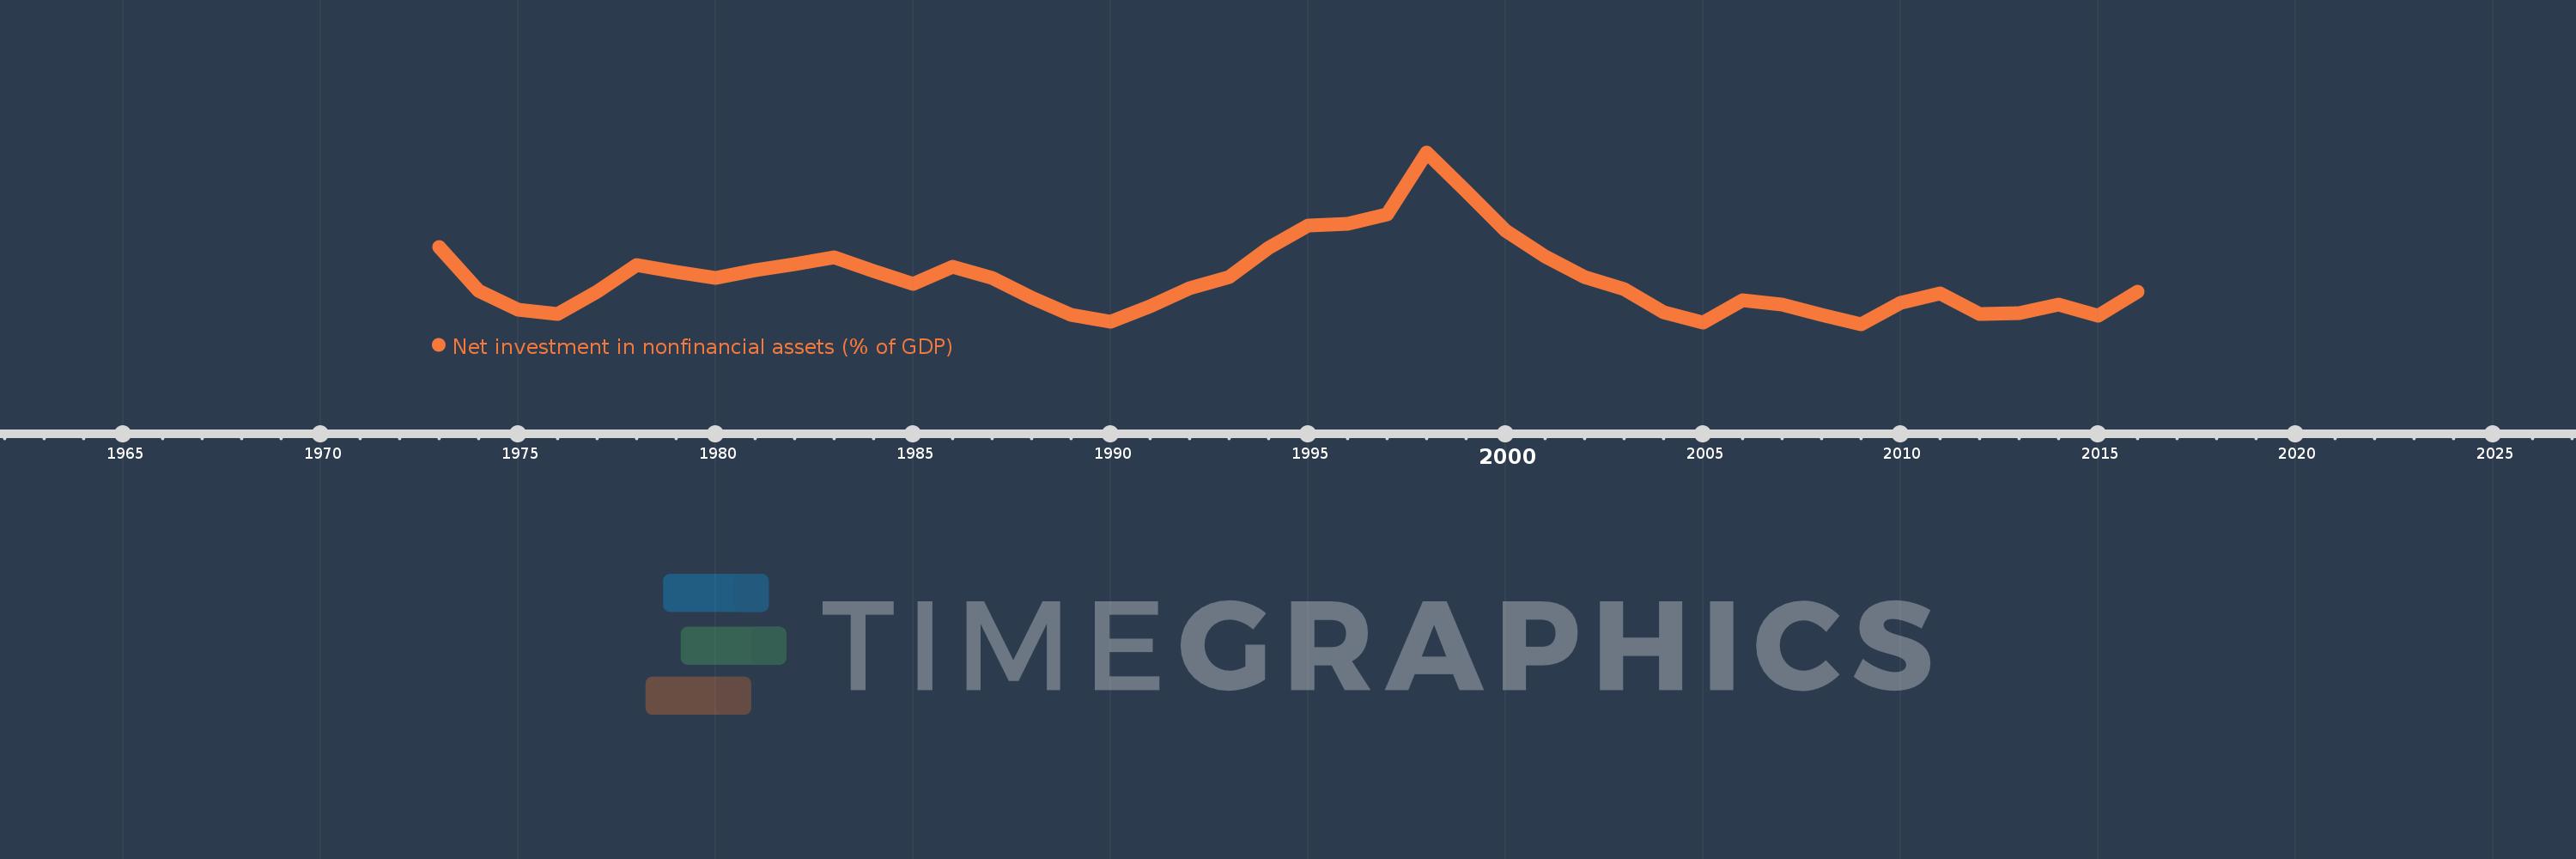
Net investment in nonfinancial assets (% of GDP)
2016,2015,2014,2013,2012,2011,2010,2009,2008,2007,2006,2005,2004,2003,2002,2001,2000,1999,1998,1997,1996,1995,1994,1993,1992,1991,1990,1989,1988,1987,1986,1985,1984,1983,1982,1981,1980,1979,1978,1977,1976,1975,1974,1973
This statistics in other country:
AfghanistanAlbaniaAlgeriaAngolaAntigua and BarbudaArmeniaAustraliaAustriaAzerbaijanBahamas, TheBahrainBangladeshBarbadosBelarusBelgiumBelizeBhutanBoliviaBosnia and HerzegovinaBrazilBurundiCabo VerdeCambodiaCanadaCaribbean small statesCentral African RepublicCentral Europe and the BalticsChileChinaCongo, Dem. Rep.Congo, Rep.Costa RicaCote d'IvoireCroatiaCyprusCzech RepublicDenmarkDominicaDominican RepublicEarly-demographic dividendEast Asia & Pacific (excluding high income)East Asia & Pacific (IDA & IBRD countries)Egypt, Arab Rep.El SalvadorEquatorial GuineaEstoniaEthiopiaEuro areaEurope & Central AsiaEurope & Central Asia (excluding high income)Europe & Central Asia (IDA & IBRD countries)European UnionFijiFinlandFranceGambia, TheGeorgiaGermanyGreeceGuatemalaHigh incomeHondurasHungaryIBRD onlyIcelandIDA & IBRD totalIDA blendIndiaIndonesiaIran, Islamic Rep.IraqIrelandIsraelItalyJamaicaKazakhstanKiribatiKorea, Rep.Kyrgyz RepublicLao PDRLate-demographic dividendLatin America & Caribbean Latin America & Caribbean (excluding high income)Latin America & the Caribbean (IDA & IBRD countries)LatviaLebanonLithuaniaLow & middle incomeLower middle incomeLuxembourgMacao SAR, ChinaMacedonia, FYRMadagascarMalawiMaldivesMaliMaltaMauritiusMexicoMicronesia, Fed. Sts.Middle East & North Africa (excluding high income)Middle East & North Africa (IDA & IBRD countries)Middle incomeMoldovaMongoliaMoroccoMozambiqueNamibiaNepalNetherlandsNew ZealandNicaraguaNigeriaNorth AmericaNorwayOECD membersOmanOther small statesPacific island small statesPakistanParaguayPeruPhilippinesPolandPortugalPost-demographic dividendQatarRomaniaRussian FederationRwandaSamoaSan MarinoSao Tome and PrincipeSenegalSerbiaSierra LeoneSingaporeSlovak RepublicSmall statesSolomon IslandsSouth AfricaSouth AsiaSouth Asia (IDA & IBRD)SpainSri LankaSub-Saharan Africa Sub-Saharan Africa (excluding high income)Sub-Saharan Africa (IDA & IBRD countries)SurinameSwazilandSwedenSwitzerlandSyrian Arab RepublicThailandTimor-LesteTrinidad and TobagoTurkeyUgandaUkraineUnited Arab EmiratesUnited KingdomUnited StatesUpper middle incomeUruguayVanuatuVietnamWest Bank and GazaWorldYemen, Rep.Zimbabwe Timeline:
This timeline shows a graph from 1973 to 2016 of Thailand. No data until 1972. Number of actual observations by date: 44.
Source name:
World Development Indicators
Source organization:
International Monetary Fund, Government Finance Statistics Yearbook and data files.
Categories, topics:
Public Sector
Last updated:
apr 23, 2017
Indicators value changes by year
At the date of observation
Value
Absolute change
Change from previous value
jan 1, 1973
4.16
+4.16
0.0%
jan 1, 1974
2.791
-1.369
-32.92%
jan 1, 1975
2.186
-0.605
-21.68%
jan 1, 1976
2.066
-0.12
-5.47%
jan 1, 1977
2.747
+0.681
32.95%
jan 1, 1978
3.588
+0.841
30.62%
jan 1, 1979
3.383
-0.204
-5.69%
jan 1, 1980
3.177
-0.207
-6.11%
jan 1, 1981
3.436
+0.259
8.15%
jan 1, 1982
3.6
+0.165
4.8%
jan 1, 1983
3.836
+0.236
6.54%
jan 1, 1984
3.386
-0.449
-11.72%
jan 1, 1985
3.003
-0.383
-11.31%
jan 1, 1986
3.521
+0.517
17.23%
jan 1, 1987
3.184
-0.337
-9.57%
jan 1, 1988
2.579
-0.604
-18.99%
jan 1, 1989
2.039
-0.54
-20.94%
jan 1, 1990
1.825
-0.214
-10.5%
jan 1, 1991
2.3
+0.475
26.05%
jan 1, 1992
2.858
+0.557
24.22%
jan 1, 1993
3.213
+0.355
12.44%
jan 1, 1994
4.124
+0.911
28.35%
jan 1, 1995
4.805
+0.681
16.52%
jan 1, 1996
4.857
+0.052
1.09%
jan 1, 1997
5.153
+0.296
6.1%
jan 1, 1998
7.096
+1.943
37.71%
jan 1, 1999
5.901
-1.195
-16.84%
jan 1, 2000
4.669
-1.233
-20.89%
jan 1, 2001
3.863
-0.806
-17.26%
jan 1, 2002
3.207
-0.656
-16.99%
jan 1, 2003
2.845
-0.362
-11.3%
jan 1, 2004
2.11
-0.735
-25.83%
jan 1, 2005
1.791
-0.318
-15.09%
jan 1, 2006
2.497
+0.705
39.38%
jan 1, 2007
2.341
-0.156
-6.24%
jan 1, 2008
2.032
-0.309
-13.19%
jan 1, 2009
1.739
-0.293
-14.44%
jan 1, 2010
2.397
+0.658
37.85%
jan 1, 2011
2.703
+0.305
12.74%
jan 1, 2012
2.058
-0.644
-23.84%
jan 1, 2013
2.085
+0.026
1.28%
jan 1, 2014
2.341
+0.257
12.31%
jan 1, 2015
2.004
-0.337
-14.4%
jan 1, 2016
2.764
+0.76
37.93%
Ranking of countries by current statistics by years


Comments: