29
/
en
AIzaSyAYiBZKx7MnpbEhh9jyipgxe19OcubqV5w
April 1, 2024
105236
Chile
CHL
true
2
1
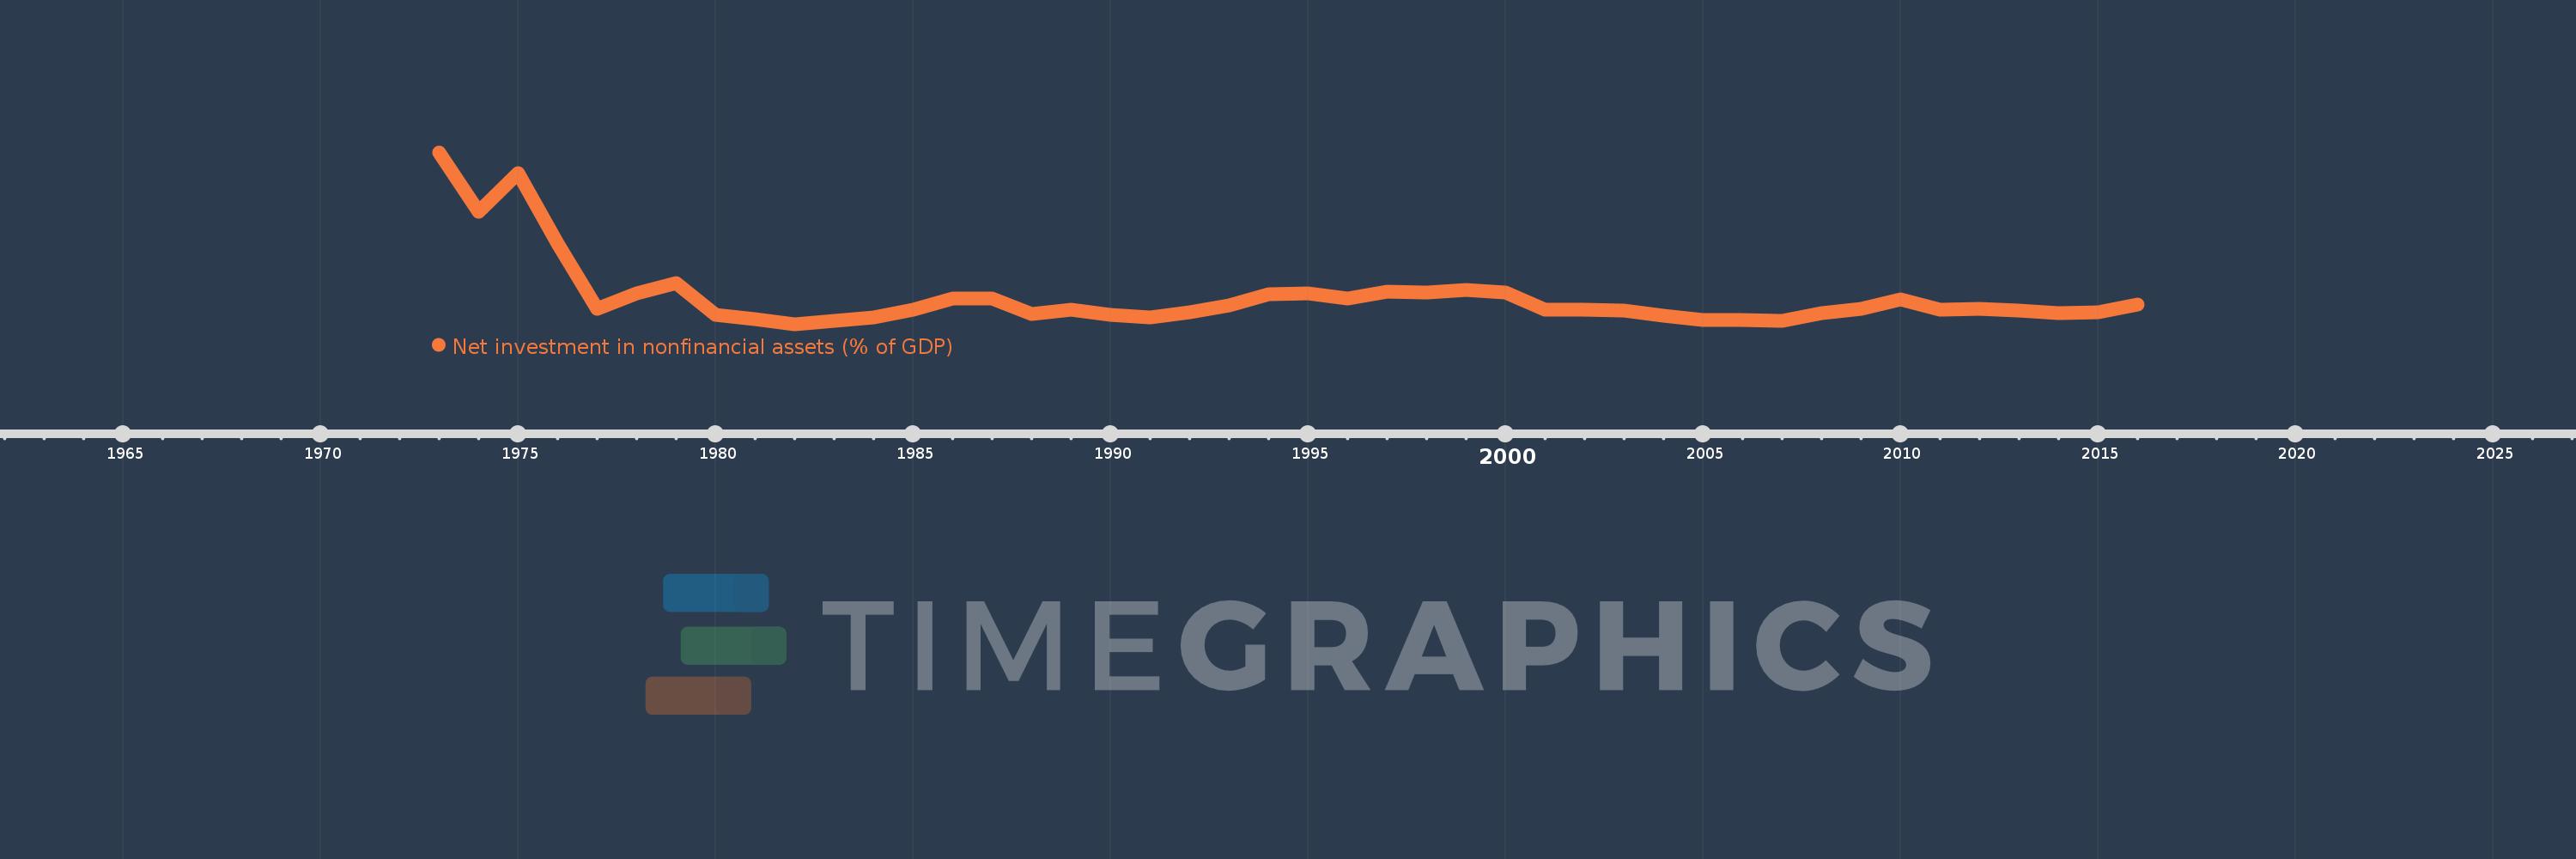
Net investment in nonfinancial assets (% of GDP)
2016,2015,2014,2013,2012,2011,2010,2009,2008,2007,2006,2005,2004,2003,2002,2001,2000,1999,1998,1997,1996,1995,1994,1993,1992,1991,1990,1989,1988,1987,1986,1985,1984,1983,1982,1981,1980,1979,1978,1977,1976,1975,1974,1973
This statistics in other country:
AfghanistanAlbaniaAlgeriaAngolaAntigua and BarbudaArmeniaAustraliaAustriaAzerbaijanBahamas, TheBahrainBangladeshBarbadosBelarusBelgiumBelizeBhutanBoliviaBosnia and HerzegovinaBrazilBurundiCabo VerdeCambodiaCanadaCaribbean small statesCentral African RepublicCentral Europe and the BalticsChileChinaCongo, Dem. Rep.Congo, Rep.Costa RicaCote d'IvoireCroatiaCyprusCzech RepublicDenmarkDominicaDominican RepublicEarly-demographic dividendEast Asia & Pacific (excluding high income)East Asia & Pacific (IDA & IBRD countries)Egypt, Arab Rep.El SalvadorEquatorial GuineaEstoniaEthiopiaEuro areaEurope & Central AsiaEurope & Central Asia (excluding high income)Europe & Central Asia (IDA & IBRD countries)European UnionFijiFinlandFranceGambia, TheGeorgiaGermanyGreeceGuatemalaHigh incomeHondurasHungaryIBRD onlyIcelandIDA & IBRD totalIDA blendIndiaIndonesiaIran, Islamic Rep.IraqIrelandIsraelItalyJamaicaKazakhstanKiribatiKorea, Rep.Kyrgyz RepublicLao PDRLate-demographic dividendLatin America & Caribbean Latin America & Caribbean (excluding high income)Latin America & the Caribbean (IDA & IBRD countries)LatviaLebanonLithuaniaLow & middle incomeLower middle incomeLuxembourgMacao SAR, ChinaMacedonia, FYRMadagascarMalawiMaldivesMaliMaltaMauritiusMexicoMicronesia, Fed. Sts.Middle East & North Africa (excluding high income)Middle East & North Africa (IDA & IBRD countries)Middle incomeMoldovaMongoliaMoroccoMozambiqueNamibiaNepalNetherlandsNew ZealandNicaraguaNigeriaNorth AmericaNorwayOECD membersOmanOther small statesPacific island small statesPakistanParaguayPeruPhilippinesPolandPortugalPost-demographic dividendQatarRomaniaRussian FederationRwandaSamoaSan MarinoSao Tome and PrincipeSenegalSerbiaSierra LeoneSingaporeSlovak RepublicSmall statesSolomon IslandsSouth AfricaSouth AsiaSouth Asia (IDA & IBRD)SpainSri LankaSub-Saharan Africa Sub-Saharan Africa (excluding high income)Sub-Saharan Africa (IDA & IBRD countries)SurinameSwazilandSwedenSwitzerlandSyrian Arab RepublicThailandTimor-LesteTrinidad and TobagoTurkeyUgandaUkraineUnited Arab EmiratesUnited KingdomUnited StatesUpper middle incomeUruguayVanuatuVietnamWest Bank and GazaWorldYemen, Rep.Zimbabwe Timeline:
This timeline shows a graph from 1973 to 2016 of Chile. No data until 1972. Number of actual observations by date: 44.
Source name:
World Development Indicators
Source organization:
International Monetary Fund, Government Finance Statistics Yearbook and data files.
Categories, topics:
Public Sector
Last updated:
apr 23, 2017
Indicators value changes by year
At the date of observation
Value
Absolute change
Change from previous value
jan 1, 1973
8.324
+8.324
0.0%
jan 1, 1974
5.962
-2.361
-28.37%
jan 1, 1975
7.492
+1.53
25.65%
jan 1, 1976
4.707
-2.785
-37.18%
jan 1, 1977
2.114
-2.592
-55.08%
jan 1, 1978
2.738
+0.624
29.51%
jan 1, 1979
3.148
+0.41
14.97%
jan 1, 1980
1.883
-1.265
-40.19%
jan 1, 1981
1.739
-0.144
-7.65%
jan 1, 1982
1.522
-0.217
-12.47%
jan 1, 1983
1.656
+0.134
8.79%
jan 1, 1984
1.789
+0.133
8.04%
jan 1, 1985
2.09
+0.301
16.8%
jan 1, 1986
2.525
+0.435
20.81%
jan 1, 1987
2.532
+0.007
0.29%
jan 1, 1988
1.931
-0.601
-23.75%
jan 1, 1989
2.083
+0.153
7.91%
jan 1, 1990
1.889
-0.194
-9.33%
jan 1, 1991
1.787
-0.102
-5.41%
jan 1, 1992
2.004
+0.217
12.13%
jan 1, 1993
2.282
+0.278
13.88%
jan 1, 1994
2.695
+0.413
18.1%
jan 1, 1995
2.74
+0.045
1.69%
jan 1, 1996
2.522
-0.218
-7.95%
jan 1, 1997
2.802
+0.28
11.09%
jan 1, 1998
2.787
-0.015
-0.53%
jan 1, 1999
2.888
+0.101
3.61%
jan 1, 2000
2.775
-0.113
-3.91%
jan 1, 2001
2.095
-0.679
-24.48%
jan 1, 2002
2.107
+0.012
0.57%
jan 1, 2003
2.071
-0.036
-1.71%
jan 1, 2004
1.861
-0.21
-10.16%
jan 1, 2005
1.68
-0.181
-9.71%
jan 1, 2006
1.699
+0.019
1.11%
jan 1, 2007
1.653
-0.046
-2.68%
jan 1, 2008
1.964
+0.311
18.81%
jan 1, 2009
2.122
+0.158
8.05%
jan 1, 2010
2.514
+0.392
18.45%
jan 1, 2011
2.088
-0.426
-16.94%
jan 1, 2012
2.129
+0.041
1.97%
jan 1, 2013
2.047
-0.082
-3.86%
jan 1, 2014
1.952
-0.095
-4.62%
jan 1, 2015
1.997
+0.044
2.27%
jan 1, 2016
2.296
+0.299
14.98%
Ranking of countries by current statistics by years


Comments: