29
/
en
AIzaSyAYiBZKx7MnpbEhh9jyipgxe19OcubqV5w
April 1, 2024
209606
New Zealand
NZL
true
2
1
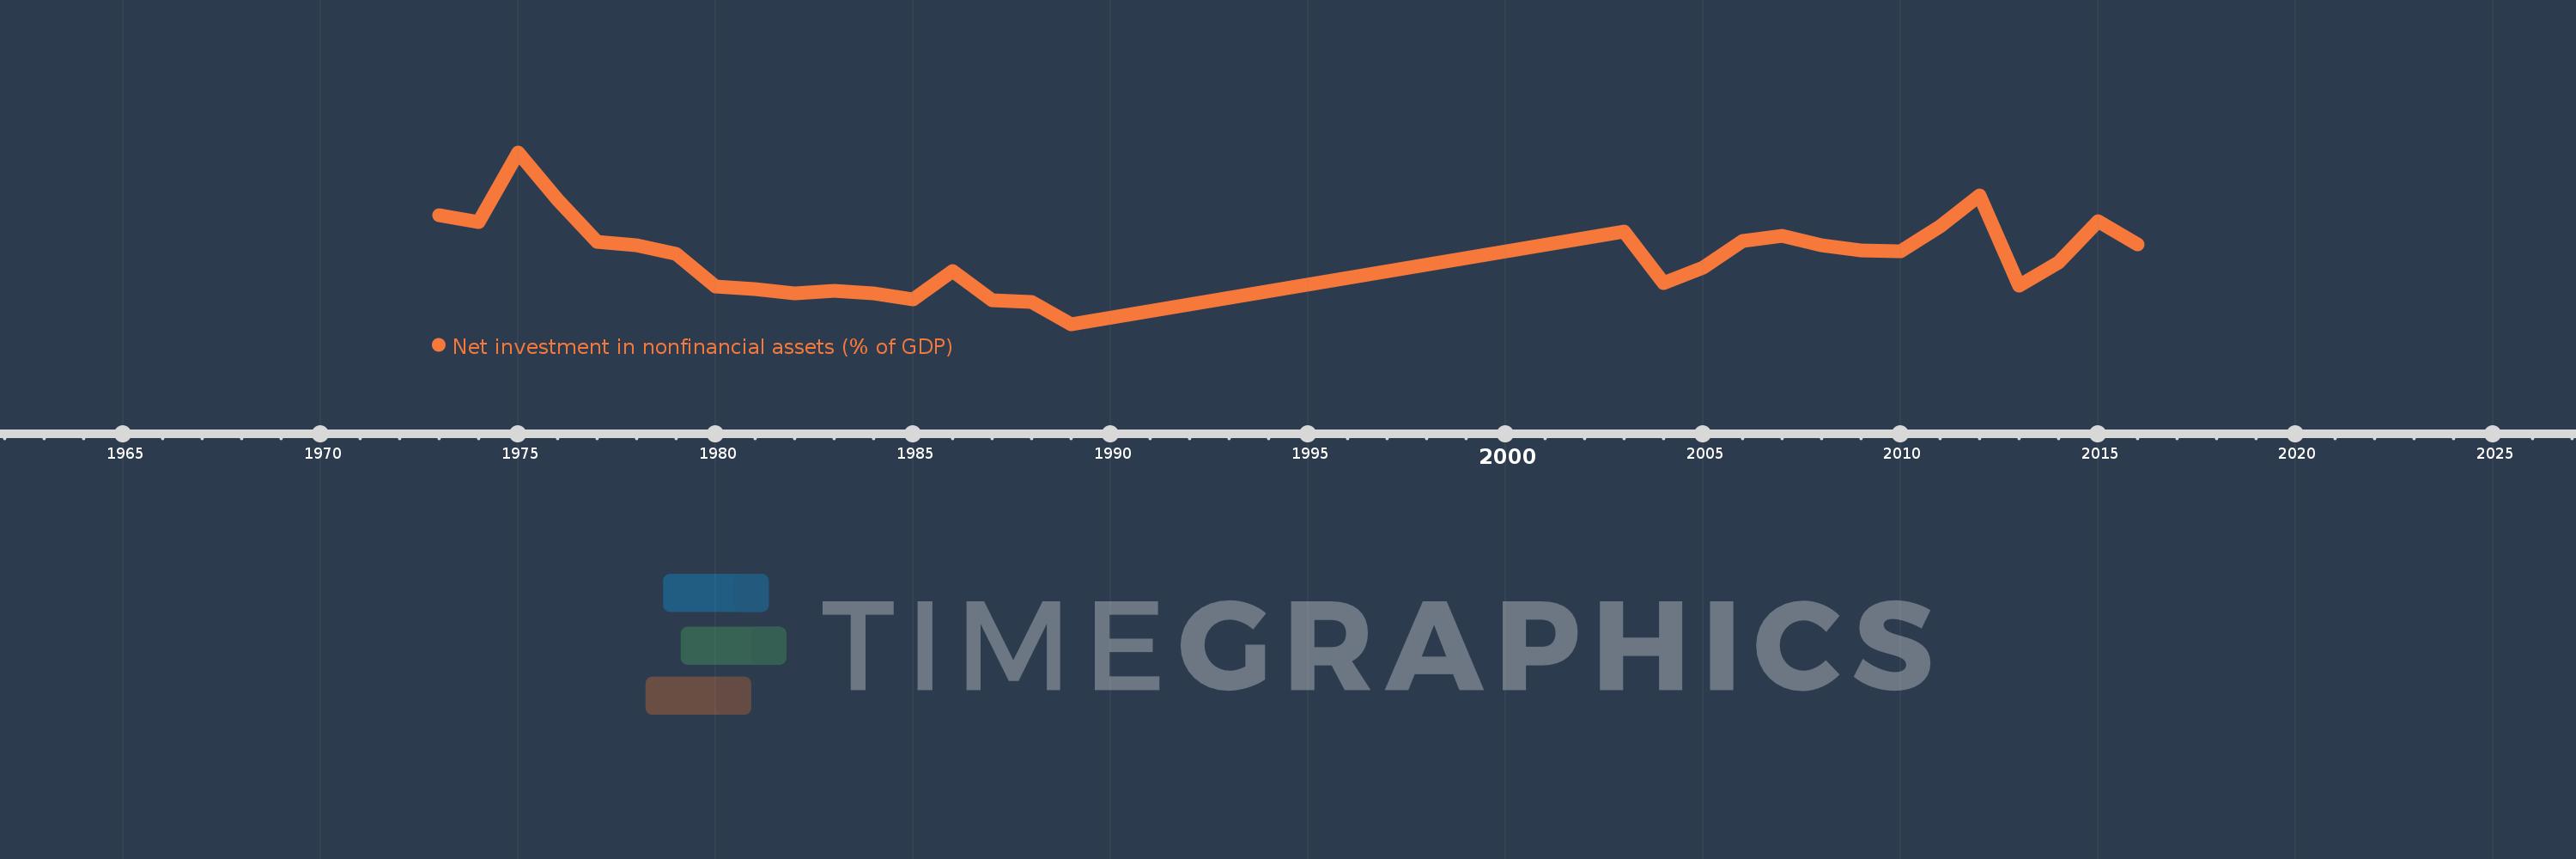
Net investment in nonfinancial assets (% of GDP)
2016,2015,2014,2013,2012,2011,2010,2009,2008,2007,2006,2005,2004,2003,1989,1988,1987,1986,1985,1984,1983,1982,1981,1980,1979,1978,1977,1976,1975,1974,1973
This statistics in other country:
AfghanistanAlbaniaAlgeriaAngolaAntigua and BarbudaArmeniaAustraliaAustriaAzerbaijanBahamas, TheBahrainBangladeshBarbadosBelarusBelgiumBelizeBhutanBoliviaBosnia and HerzegovinaBrazilBurundiCabo VerdeCambodiaCanadaCaribbean small statesCentral African RepublicCentral Europe and the BalticsChileChinaCongo, Dem. Rep.Congo, Rep.Costa RicaCote d'IvoireCroatiaCyprusCzech RepublicDenmarkDominicaDominican RepublicEarly-demographic dividendEast Asia & Pacific (excluding high income)East Asia & Pacific (IDA & IBRD countries)Egypt, Arab Rep.El SalvadorEquatorial GuineaEstoniaEthiopiaEuro areaEurope & Central AsiaEurope & Central Asia (excluding high income)Europe & Central Asia (IDA & IBRD countries)European UnionFijiFinlandFranceGambia, TheGeorgiaGermanyGreeceGuatemalaHigh incomeHondurasHungaryIBRD onlyIcelandIDA & IBRD totalIDA blendIndiaIndonesiaIran, Islamic Rep.IraqIrelandIsraelItalyJamaicaKazakhstanKiribatiKorea, Rep.Kyrgyz RepublicLao PDRLate-demographic dividendLatin America & Caribbean Latin America & Caribbean (excluding high income)Latin America & the Caribbean (IDA & IBRD countries)LatviaLebanonLithuaniaLow & middle incomeLower middle incomeLuxembourgMacao SAR, ChinaMacedonia, FYRMadagascarMalawiMaldivesMaliMaltaMauritiusMexicoMicronesia, Fed. Sts.Middle East & North Africa (excluding high income)Middle East & North Africa (IDA & IBRD countries)Middle incomeMoldovaMongoliaMoroccoMozambiqueNamibiaNepalNetherlandsNew ZealandNicaraguaNigeriaNorth AmericaNorwayOECD membersOmanOther small statesPacific island small statesPakistanParaguayPeruPhilippinesPolandPortugalPost-demographic dividendQatarRomaniaRussian FederationRwandaSamoaSan MarinoSao Tome and PrincipeSenegalSerbiaSierra LeoneSingaporeSlovak RepublicSmall statesSolomon IslandsSouth AfricaSouth AsiaSouth Asia (IDA & IBRD)SpainSri LankaSub-Saharan Africa Sub-Saharan Africa (excluding high income)Sub-Saharan Africa (IDA & IBRD countries)SurinameSwazilandSwedenSwitzerlandSyrian Arab RepublicThailandTimor-LesteTrinidad and TobagoTurkeyUgandaUkraineUnited Arab EmiratesUnited KingdomUnited StatesUpper middle incomeUruguayVanuatuVietnamWest Bank and GazaWorldYemen, Rep.Zimbabwe Timeline:
This timeline shows a graph from 1973 to 2016 of New Zealand. No data until 1972. Number of actual observations by date: 31.
Source name:
World Development Indicators
Source organization:
International Monetary Fund, Government Finance Statistics Yearbook and data files.
Categories, topics:
Public Sector
Last updated:
apr 23, 2017
Indicators value changes by year
At the date of observation
Value
Absolute change
Change from previous value
jan 1, 1973
2.363
+2.363
0.0%
jan 1, 1974
2.282
-0.08
-3.4%
jan 1, 1975
3.037
+0.755
33.06%
jan 1, 1976
2.529
-0.508
-16.72%
jan 1, 1977
2.077
-0.452
-17.88%
jan 1, 1978
2.039
-0.037
-1.8%
jan 1, 1979
1.94
-0.099
-4.86%
jan 1, 1980
1.595
-0.346
-17.82%
jan 1, 1981
1.565
-0.029
-1.85%
jan 1, 1982
1.521
-0.044
-2.84%
jan 1, 1983
1.546
+0.025
1.68%
jan 1, 1984
1.522
-0.024
-1.56%
jan 1, 1985
1.45
-0.072
-4.72%
jan 1, 1986
1.762
+0.311
21.47%
jan 1, 1987
1.441
-0.321
-18.21%
jan 1, 1988
1.427
-0.014
-0.94%
jan 1, 1989
1.185
-0.242
-16.99%
jan 1, 2003
2.18
+0.995
84.02%
jan 1, 2004
1.625
-0.556
-25.49%
jan 1, 2005
1.794
+0.169
10.41%
jan 1, 2006
2.079
+0.286
15.92%
jan 1, 2007
2.136
+0.057
2.75%
jan 1, 2008
2.033
-0.103
-4.83%
jan 1, 2009
1.98
-0.053
-2.63%
jan 1, 2010
1.972
-0.008
-0.41%
jan 1, 2011
2.243
+0.271
13.77%
jan 1, 2012
2.577
+0.334
14.9%
jan 1, 2013
1.597
-0.98
-38.04%
jan 1, 2014
1.852
+0.255
16.0%
jan 1, 2015
2.291
+0.439
23.68%
jan 1, 2016
2.047
-0.244
-10.64%
Ranking of countries by current statistics by years


Comments: