29
/
en
AIzaSyAYiBZKx7MnpbEhh9jyipgxe19OcubqV5w
April 1, 2024
283487
West Bank and Gaza
PSE
true
2
1
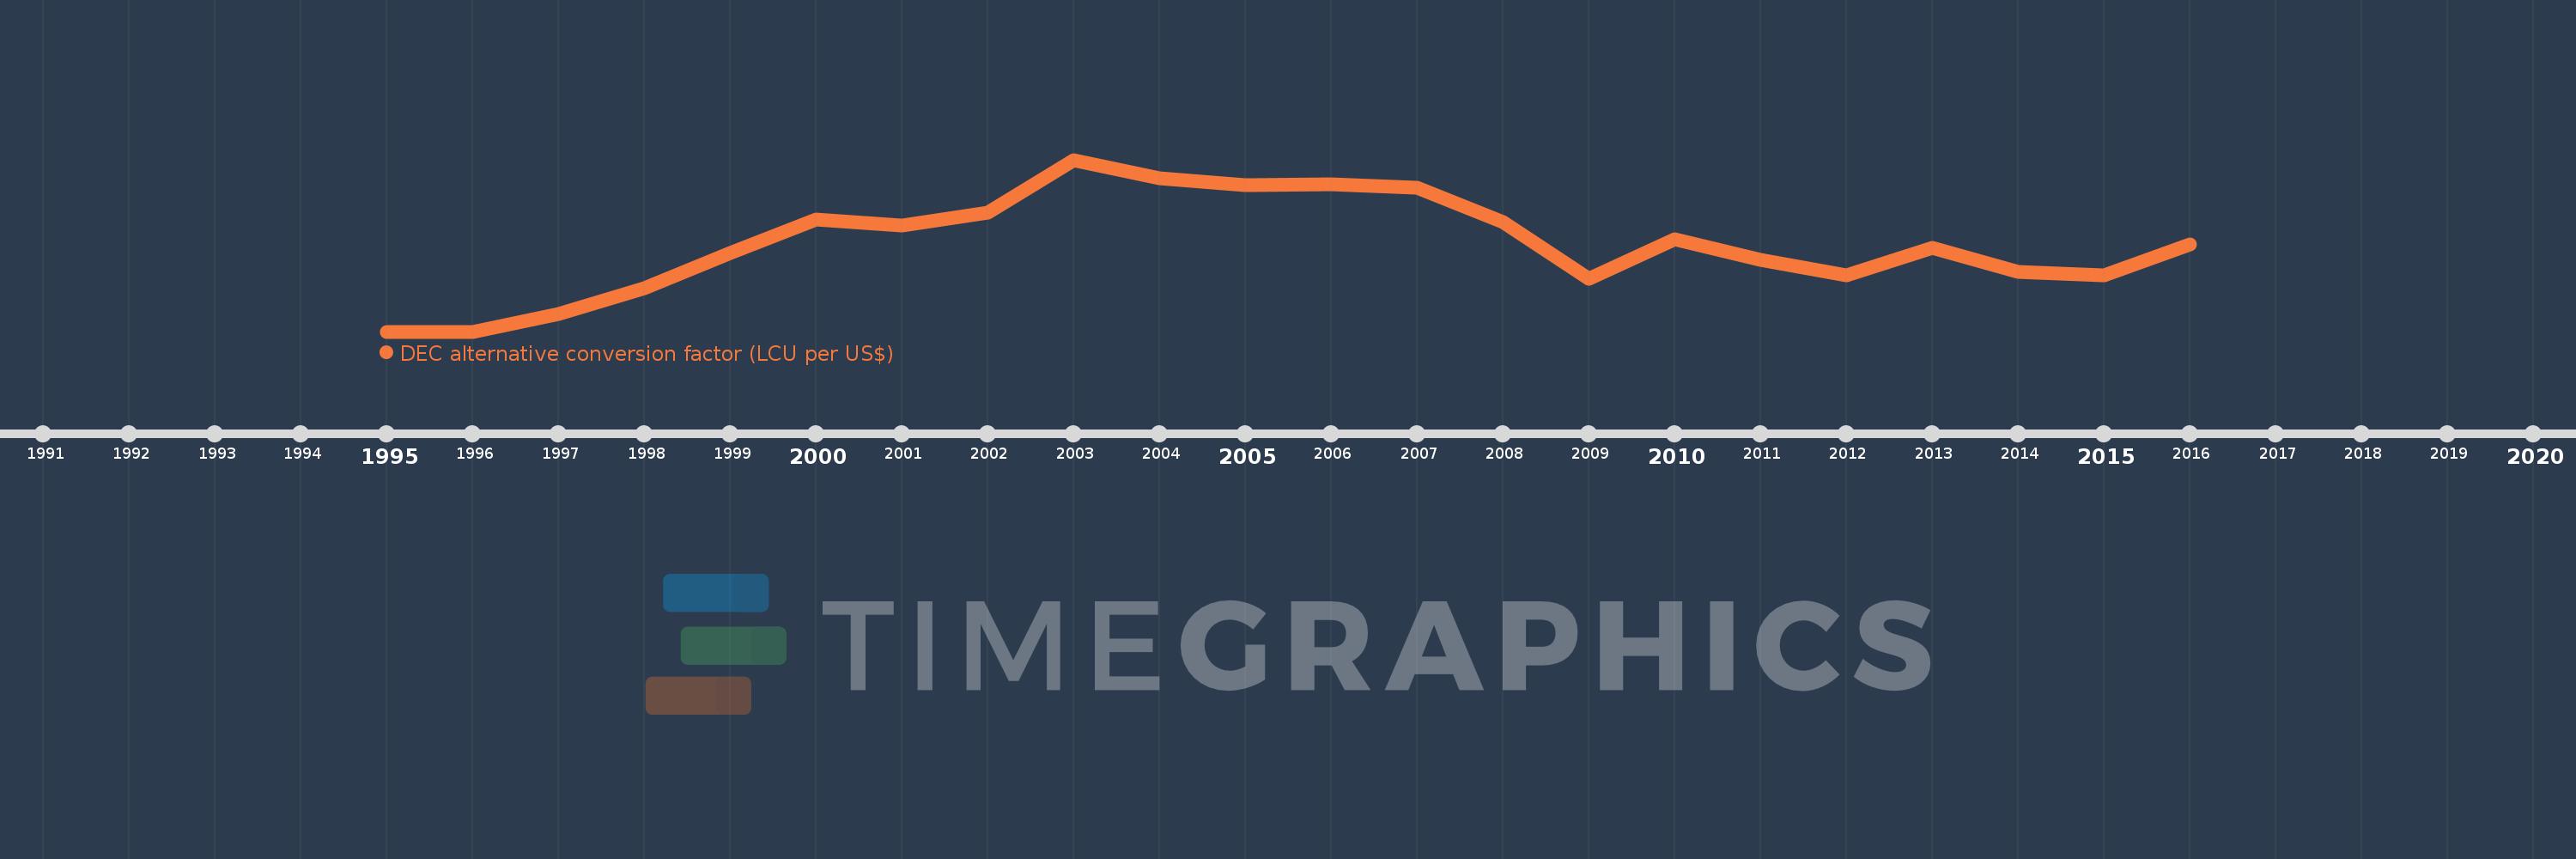
DEC alternative conversion factor (LCU per US$)
2016,2015,2014,2013,2012,2011,2010,2009,2008,2007,2006,2005,2004,2003,2002,2001,2000,1999,1998,1997,1996,1995
This statistics in other country:
AfghanistanAlbaniaAlgeriaAmerican SamoaAndorraAngolaAntigua and BarbudaArgentinaArmeniaArubaAustraliaAustriaAzerbaijanBahamas, TheBahrainBangladeshBarbadosBelarusBelgiumBelizeBeninBermudaBhutanBoliviaBosnia and HerzegovinaBotswanaBrazilBrunei DarussalamBulgariaBurkina FasoBurundiCabo VerdeCambodiaCameroonCanadaCayman IslandsCentral African RepublicChadChannel IslandsChileChinaColombiaComorosCongo, Dem. Rep.Congo, Rep.Costa RicaCote d'IvoireCroatiaCubaCyprusCzech RepublicDenmarkDjiboutiDominicaDominican RepublicEcuadorEgypt, Arab Rep.El SalvadorEquatorial GuineaEritreaEstoniaEthiopiaFaroe IslandsFijiFinlandFranceFrench PolynesiaGabonGambia, TheGeorgiaGermanyGhanaGreeceGreenlandGrenadaGuatemalaGuineaGuinea-BissauGuyanaHaitiHondurasHong Kong SAR, ChinaHungaryIcelandIndiaIndonesiaIran, Islamic Rep.IraqIrelandIsle of ManIsraelItalyJamaicaJapanJordanKazakhstanKenyaKiribatiKorea, Rep.KosovoKuwaitKyrgyz RepublicLao PDRLatviaLebanonLesothoLiberiaLibyaLiechtensteinLithuaniaLuxembourgMacao SAR, ChinaMacedonia, FYRMadagascarMalawiMalaysiaMaldivesMaliMaltaMarshall IslandsMauritaniaMauritiusMexicoMicronesia, Fed. Sts.MoldovaMonacoMongoliaMontenegroMoroccoMozambiqueMyanmarNamibiaNauruNepalNetherlandsNew CaledoniaNew ZealandNicaraguaNigerNigeriaNorwayOmanPakistanPalauPanamaPapua New GuineaParaguayPeruPhilippinesPolandPortugalPuerto RicoQatarRomaniaRussian FederationRwandaSamoaSan MarinoSao Tome and PrincipeSaudi ArabiaSenegalSerbiaSeychellesSierra LeoneSingaporeSlovak RepublicSloveniaSolomon IslandsSomaliaSouth AfricaSouth SudanSpainSri LankaSt. Kitts and NevisSt. LuciaSt. Vincent and the GrenadinesSudanSurinameSwazilandSwedenSwitzerlandSyrian Arab RepublicTajikistanTanzaniaThailandTimor-LesteTogoTongaTrinidad and TobagoTunisiaTurkeyTurkmenistanTuvaluUgandaUkraineUnited Arab EmiratesUnited KingdomUnited StatesUruguayUzbekistanVanuatuVenezuela, RBVietnamVirgin Islands (U.S.)West Bank and GazaYemen, Rep.ZambiaZimbabwe Timeline:
This timeline shows a graph from 1995 to 2016 of West Bank and Gaza. No data until 1994. Number of actual observations by date: 22.
Source name:
World Development Indicators
Source organization:
International Monetary Fund, International Financial Statistics, supplemented by World Bank staff estimates.
Categories, topics:
Economy & Growth, Financial Sector
Last updated:
apr 23, 2017
Indicators value changes by year
At the date of observation
Value
Absolute change
Change from previous value
jan 1, 1995
3.011
+3.011
0.0%
jan 1, 1996
3.011
+0.0
0.01%
jan 1, 1997
3.192
+0.18
5.99%
jan 1, 1998
3.45
+0.258
8.08%
jan 1, 1999
3.8
+0.35
10.16%
jan 1, 2000
4.14
+0.34
8.94%
jan 1, 2001
4.077
-0.062
-1.51%
jan 1, 2002
4.206
+0.128
3.15%
jan 1, 2003
4.738
+0.532
12.65%
jan 1, 2004
4.55
-0.188
-3.96%
jan 1, 2005
4.482
-0.068
-1.49%
jan 1, 2006
4.488
+0.006
0.13%
jan 1, 2007
4.456
-0.032
-0.71%
jan 1, 2008
4.108
-0.348
-7.8%
jan 1, 2009
3.54
-0.568
-13.83%
jan 1, 2010
3.94
+0.4
11.3%
jan 1, 2011
3.73
-0.21
-5.33%
jan 1, 2012
3.58
-0.15
-4.02%
jan 1, 2013
3.856
+0.276
7.71%
jan 1, 2014
3.611
-0.245
-6.36%
jan 1, 2015
3.578
-0.033
-0.91%
jan 1, 2016
3.887
+0.309
8.63%
Ranking of countries by current statistics by years


Comments: