29
/
en
AIzaSyAYiBZKx7MnpbEhh9jyipgxe19OcubqV5w
April 1, 2024
139113
Germany
DEU
true
2
1
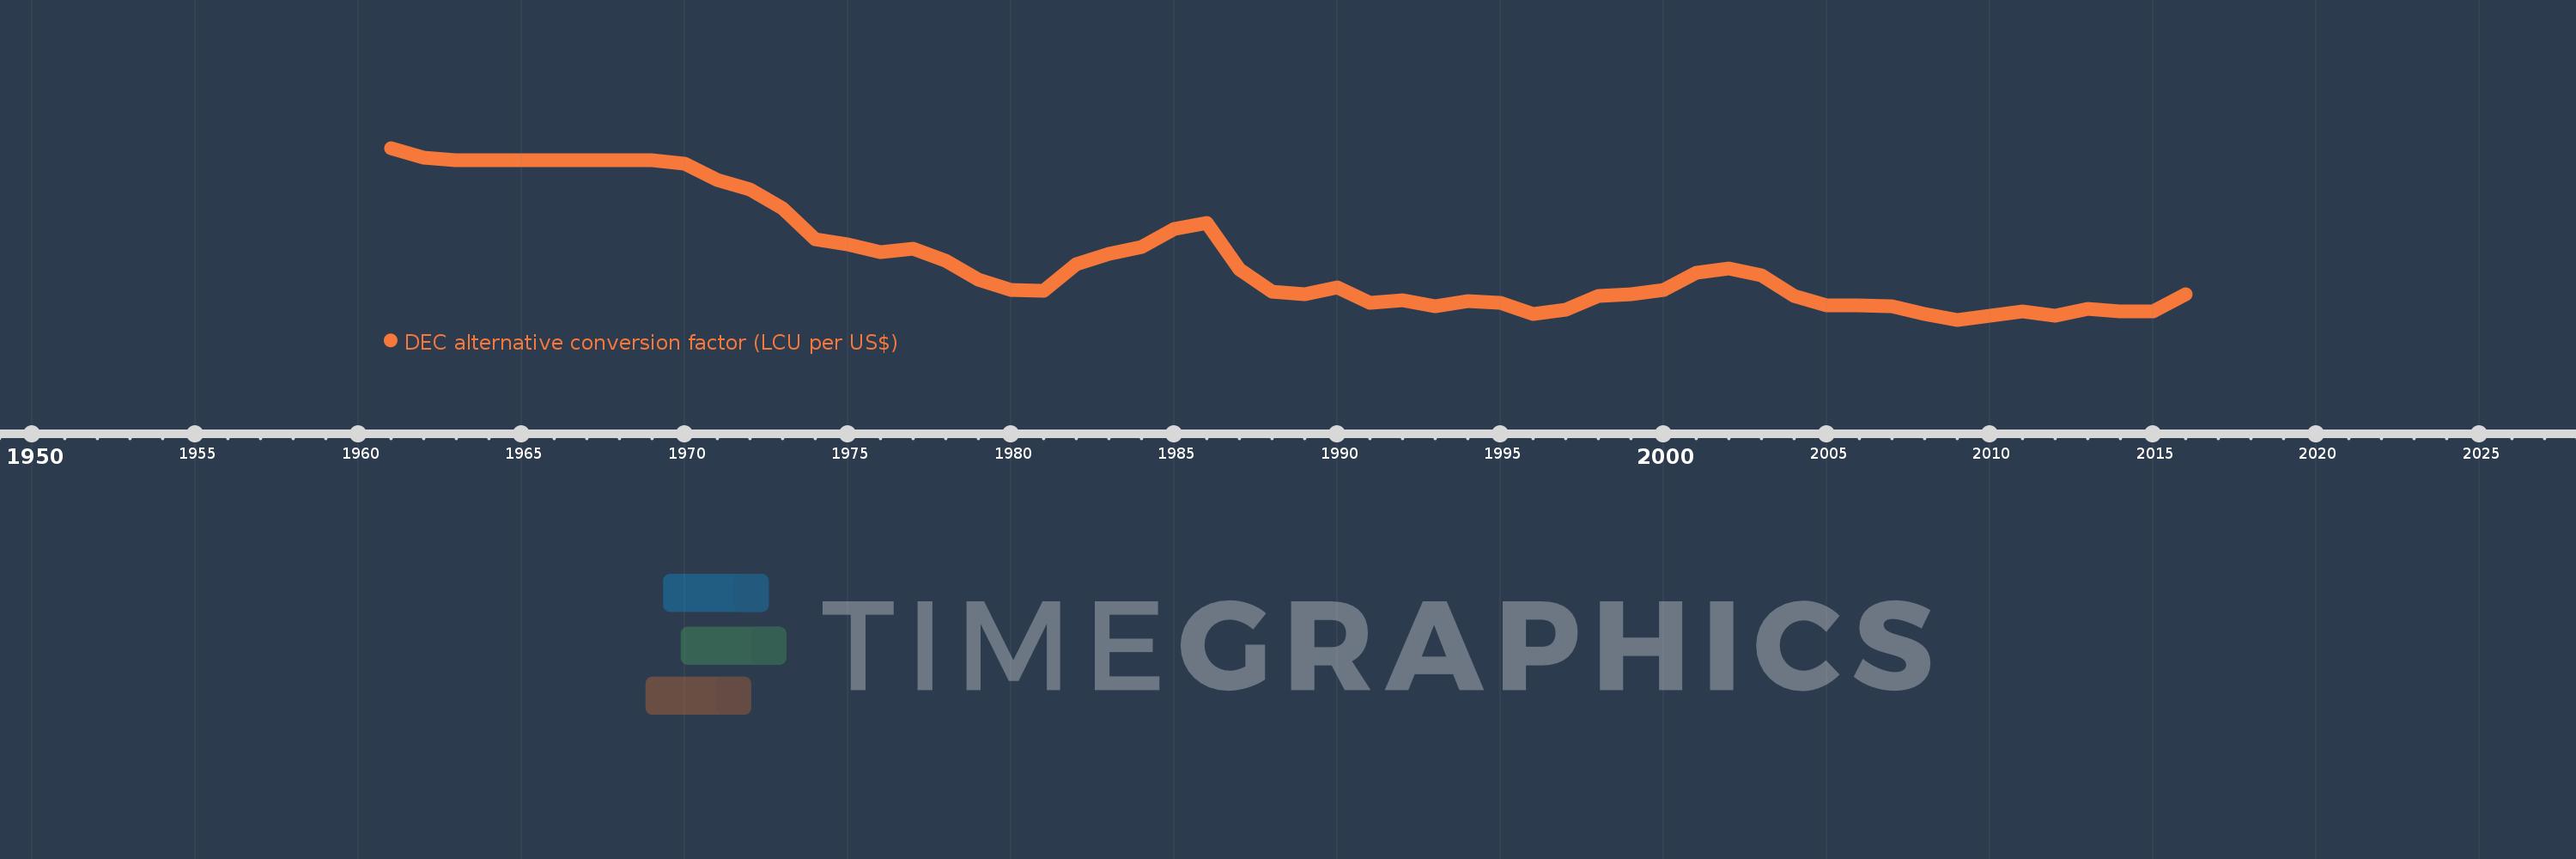
DEC alternative conversion factor (LCU per US$)
2016,2015,2014,2013,2012,2011,2010,2009,2008,2007,2006,2005,2004,2003,2002,2001,2000,1999,1998,1997,1996,1995,1994,1993,1992,1991,1990,1989,1988,1987,1986,1985,1984,1983,1982,1981,1980,1979,1978,1977,1976,1975,1974,1973,1972,1971,1970,1969,1968,1967,1966,1965,1964,1963,1962,1961
This statistics in other country:
AfghanistanAlbaniaAlgeriaAmerican SamoaAndorraAngolaAntigua and BarbudaArgentinaArmeniaArubaAustraliaAustriaAzerbaijanBahamas, TheBahrainBangladeshBarbadosBelarusBelgiumBelizeBeninBermudaBhutanBoliviaBosnia and HerzegovinaBotswanaBrazilBrunei DarussalamBulgariaBurkina FasoBurundiCabo VerdeCambodiaCameroonCanadaCayman IslandsCentral African RepublicChadChannel IslandsChileChinaColombiaComorosCongo, Dem. Rep.Congo, Rep.Costa RicaCote d'IvoireCroatiaCubaCyprusCzech RepublicDenmarkDjiboutiDominicaDominican RepublicEcuadorEgypt, Arab Rep.El SalvadorEquatorial GuineaEritreaEstoniaEthiopiaFaroe IslandsFijiFinlandFranceFrench PolynesiaGabonGambia, TheGeorgiaGermanyGhanaGreeceGreenlandGrenadaGuatemalaGuineaGuinea-BissauGuyanaHaitiHondurasHong Kong SAR, ChinaHungaryIcelandIndiaIndonesiaIran, Islamic Rep.IraqIrelandIsle of ManIsraelItalyJamaicaJapanJordanKazakhstanKenyaKiribatiKorea, Rep.KosovoKuwaitKyrgyz RepublicLao PDRLatviaLebanonLesothoLiberiaLibyaLiechtensteinLithuaniaLuxembourgMacao SAR, ChinaMacedonia, FYRMadagascarMalawiMalaysiaMaldivesMaliMaltaMarshall IslandsMauritaniaMauritiusMexicoMicronesia, Fed. Sts.MoldovaMonacoMongoliaMontenegroMoroccoMozambiqueMyanmarNamibiaNauruNepalNetherlandsNew CaledoniaNew ZealandNicaraguaNigerNigeriaNorwayOmanPakistanPalauPanamaPapua New GuineaParaguayPeruPhilippinesPolandPortugalPuerto RicoQatarRomaniaRussian FederationRwandaSamoaSan MarinoSao Tome and PrincipeSaudi ArabiaSenegalSerbiaSeychellesSierra LeoneSingaporeSlovak RepublicSloveniaSolomon IslandsSomaliaSouth AfricaSouth SudanSpainSri LankaSt. Kitts and NevisSt. LuciaSt. Vincent and the GrenadinesSudanSurinameSwazilandSwedenSwitzerlandSyrian Arab RepublicTajikistanTanzaniaThailandTimor-LesteTogoTongaTrinidad and TobagoTunisiaTurkeyTurkmenistanTuvaluUgandaUkraineUnited Arab EmiratesUnited KingdomUnited StatesUruguayUzbekistanVanuatuVenezuela, RBVietnamVirgin Islands (U.S.)West Bank and GazaYemen, Rep.ZambiaZimbabwe Timeline:
This timeline shows a graph from 1961 to 2016 of Germany. No data until 1960. Number of actual observations by date: 56.
Source name:
World Development Indicators
Source organization:
International Monetary Fund, International Financial Statistics, supplemented by World Bank staff estimates.
Categories, topics:
Economy & Growth, Financial Sector
Last updated:
apr 23, 2017
Indicators value changes by year
At the date of observation
Value
Absolute change
Change from previous value
jan 1, 1961
2.147
+2.147
0.0%
jan 1, 1962
2.062
-0.085
-3.97%
jan 1, 1963
2.045
-0.017
-0.83%
jan 1, 1964
2.045
0.0
0.0%
jan 1, 1965
2.045
0.0
0.0%
jan 1, 1966
2.045
0.0
0.0%
jan 1, 1967
2.045
0.0
0.0%
jan 1, 1968
2.045
0.0
0.0%
jan 1, 1969
2.045
0.0
0.0%
jan 1, 1970
2.016
-0.029
-1.42%
jan 1, 1971
1.871
-0.145
-7.19%
jan 1, 1972
1.793
-0.078
-4.17%
jan 1, 1973
1.63
-0.163
-9.09%
jan 1, 1974
1.367
-0.264
-16.18%
jan 1, 1975
1.323
-0.043
-3.18%
jan 1, 1976
1.258
-0.065
-4.93%
jan 1, 1977
1.287
+0.03
2.35%
jan 1, 1978
1.187
-0.1
-7.78%
jan 1, 1979
1.027
-0.16
-13.5%
jan 1, 1980
0.937
-0.09
-8.75%
jan 1, 1981
0.929
-0.008
-0.82%
jan 1, 1982
1.155
+0.226
24.33%
jan 1, 1983
1.241
+0.085
7.37%
jan 1, 1984
1.306
+0.065
5.22%
jan 1, 1985
1.455
+0.15
11.46%
jan 1, 1986
1.505
+0.05
3.44%
jan 1, 1987
1.11
-0.395
-26.24%
jan 1, 1988
0.919
-0.191
-17.23%
jan 1, 1989
0.898
-0.021
-2.3%
jan 1, 1990
0.961
+0.063
7.06%
jan 1, 1991
0.826
-0.135
-14.06%
jan 1, 1992
0.849
+0.022
2.71%
jan 1, 1993
0.798
-0.05
-5.89%
jan 1, 1994
0.845
+0.047
5.86%
jan 1, 1995
0.83
-0.016
-1.85%
jan 1, 1996
0.733
-0.097
-11.69%
jan 1, 1997
0.769
+0.037
5.01%
jan 1, 1998
0.887
+0.117
15.23%
jan 1, 1999
0.9
+0.013
1.48%
jan 1, 2000
0.939
+0.039
4.32%
jan 1, 2001
1.085
+0.147
15.64%
jan 1, 2002
1.117
+0.032
2.96%
jan 1, 2003
1.063
-0.055
-4.91%
jan 1, 2004
0.886
-0.177
-16.62%
jan 1, 2005
0.805
-0.081
-9.1%
jan 1, 2006
0.804
-0.001
-0.16%
jan 1, 2007
0.797
-0.007
-0.87%
jan 1, 2008
0.731
-0.067
-8.34%
jan 1, 2009
0.683
-0.048
-6.56%
jan 1, 2010
0.72
+0.037
5.43%
jan 1, 2011
0.755
+0.035
4.89%
jan 1, 2012
0.719
-0.036
-4.72%
jan 1, 2013
0.778
+0.059
8.19%
jan 1, 2014
0.753
-0.025
-3.23%
jan 1, 2015
0.754
+0.001
0.08%
jan 1, 2016
0.902
+0.148
19.63%
Ranking of countries by current statistics by years


Comments: