29
/
en
AIzaSyAYiBZKx7MnpbEhh9jyipgxe19OcubqV5w
April 1, 2024
225745
Portugal
PRT
true
2
1
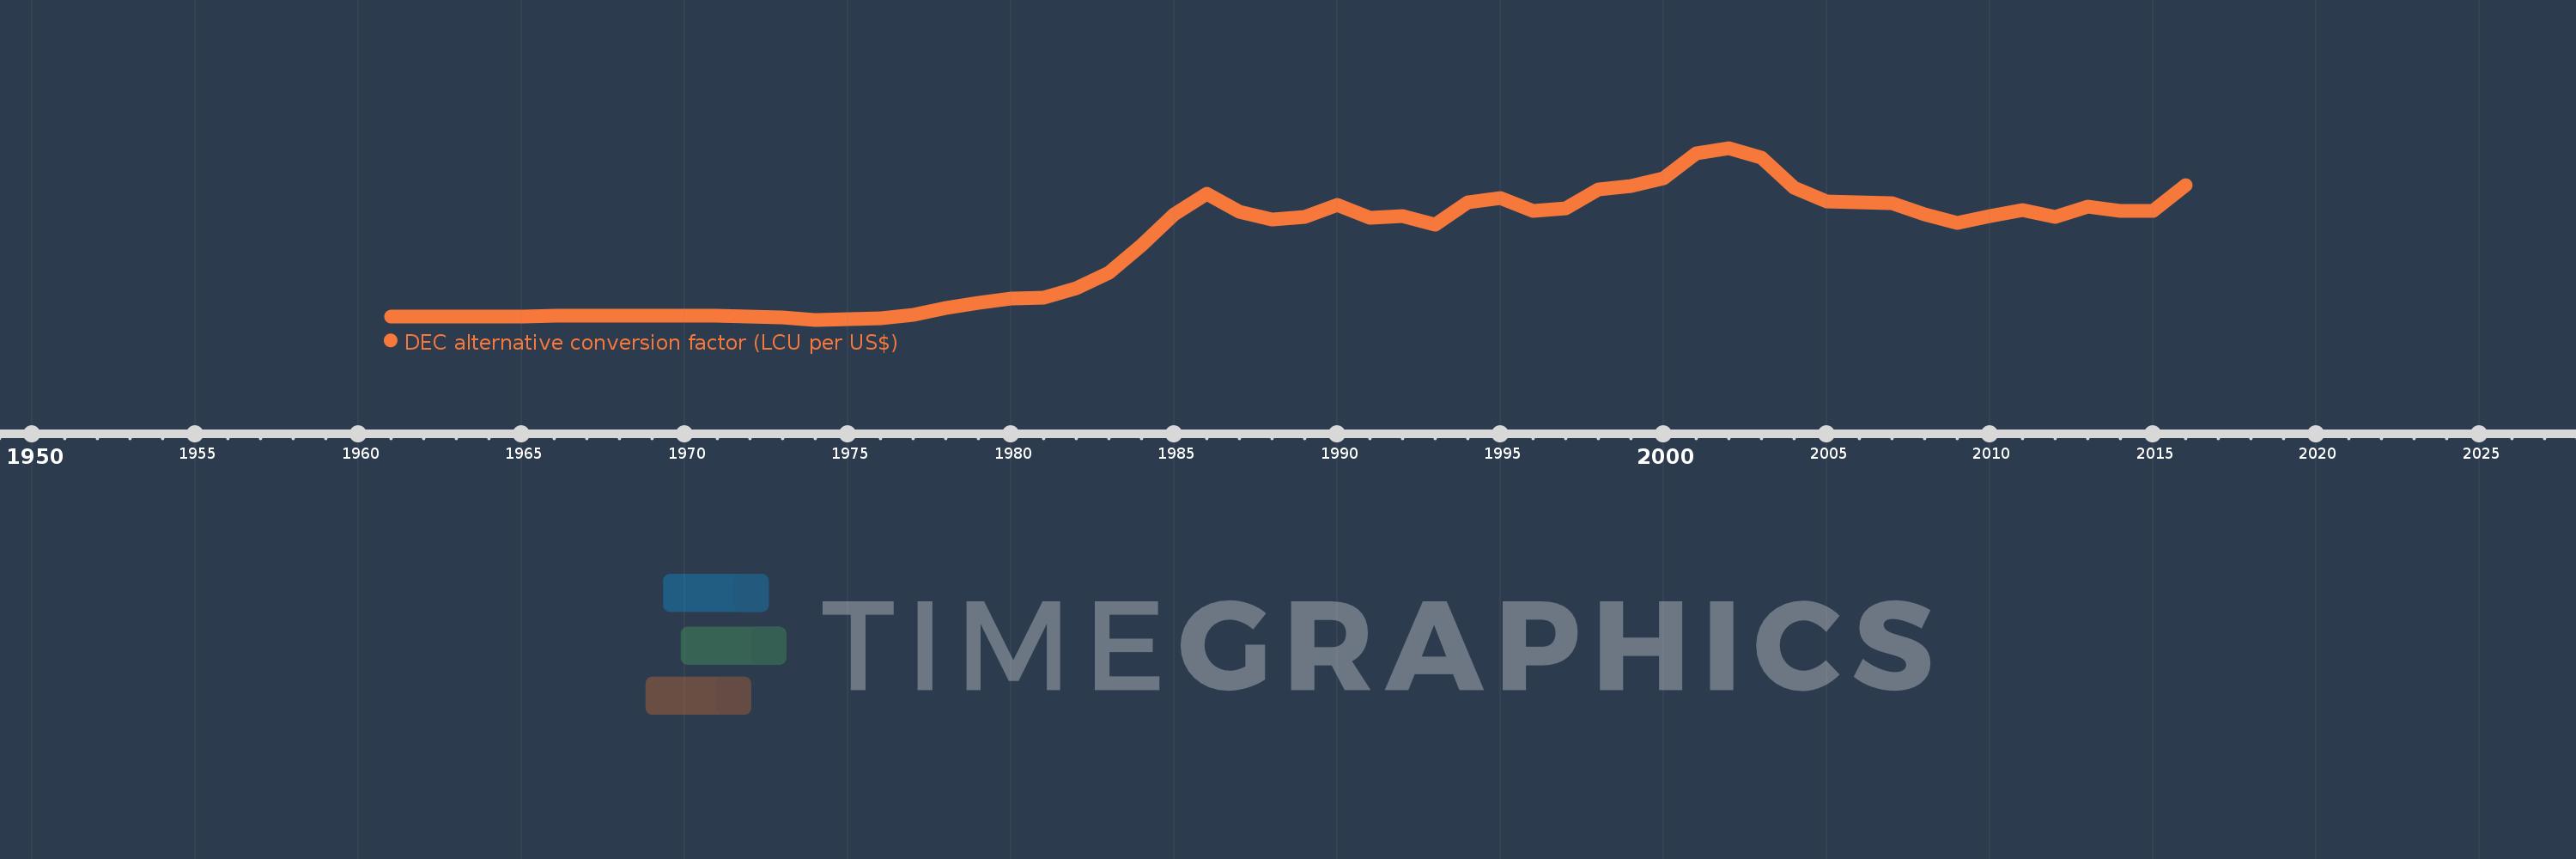
DEC alternative conversion factor (LCU per US$)
2016,2015,2014,2013,2012,2011,2010,2009,2008,2007,2006,2005,2004,2003,2002,2001,2000,1999,1998,1997,1996,1995,1994,1993,1992,1991,1990,1989,1988,1987,1986,1985,1984,1983,1982,1981,1980,1979,1978,1977,1976,1975,1974,1973,1972,1971,1970,1969,1968,1967,1966,1965,1964,1963,1962,1961
This statistics in other country:
AfghanistanAlbaniaAlgeriaAmerican SamoaAndorraAngolaAntigua and BarbudaArgentinaArmeniaArubaAustraliaAustriaAzerbaijanBahamas, TheBahrainBangladeshBarbadosBelarusBelgiumBelizeBeninBermudaBhutanBoliviaBosnia and HerzegovinaBotswanaBrazilBrunei DarussalamBulgariaBurkina FasoBurundiCabo VerdeCambodiaCameroonCanadaCayman IslandsCentral African RepublicChadChannel IslandsChileChinaColombiaComorosCongo, Dem. Rep.Congo, Rep.Costa RicaCote d'IvoireCroatiaCubaCyprusCzech RepublicDenmarkDjiboutiDominicaDominican RepublicEcuadorEgypt, Arab Rep.El SalvadorEquatorial GuineaEritreaEstoniaEthiopiaFaroe IslandsFijiFinlandFranceFrench PolynesiaGabonGambia, TheGeorgiaGermanyGhanaGreeceGreenlandGrenadaGuatemalaGuineaGuinea-BissauGuyanaHaitiHondurasHong Kong SAR, ChinaHungaryIcelandIndiaIndonesiaIran, Islamic Rep.IraqIrelandIsle of ManIsraelItalyJamaicaJapanJordanKazakhstanKenyaKiribatiKorea, Rep.KosovoKuwaitKyrgyz RepublicLao PDRLatviaLebanonLesothoLiberiaLibyaLiechtensteinLithuaniaLuxembourgMacao SAR, ChinaMacedonia, FYRMadagascarMalawiMalaysiaMaldivesMaliMaltaMarshall IslandsMauritaniaMauritiusMexicoMicronesia, Fed. Sts.MoldovaMonacoMongoliaMontenegroMoroccoMozambiqueMyanmarNamibiaNauruNepalNetherlandsNew CaledoniaNew ZealandNicaraguaNigerNigeriaNorwayOmanPakistanPalauPanamaPapua New GuineaParaguayPeruPhilippinesPolandPortugalPuerto RicoQatarRomaniaRussian FederationRwandaSamoaSan MarinoSao Tome and PrincipeSaudi ArabiaSenegalSerbiaSeychellesSierra LeoneSingaporeSlovak RepublicSloveniaSolomon IslandsSomaliaSouth AfricaSouth SudanSpainSri LankaSt. Kitts and NevisSt. LuciaSt. Vincent and the GrenadinesSudanSurinameSwazilandSwedenSwitzerlandSyrian Arab RepublicTajikistanTanzaniaThailandTimor-LesteTogoTongaTrinidad and TobagoTunisiaTurkeyTurkmenistanTuvaluUgandaUkraineUnited Arab EmiratesUnited KingdomUnited StatesUruguayUzbekistanVanuatuVenezuela, RBVietnamVirgin Islands (U.S.)West Bank and GazaYemen, Rep.ZambiaZimbabwe Timeline:
This timeline shows a graph from 1961 to 2016 of Portugal. No data until 1960. Number of actual observations by date: 56.
Source name:
World Development Indicators
Source organization:
International Monetary Fund, International Financial Statistics, supplemented by World Bank staff estimates.
Categories, topics:
Economy & Growth, Financial Sector
Last updated:
apr 23, 2017
Indicators value changes by year
At the date of observation
Value
Absolute change
Change from previous value
jan 1, 1961
0.142
+0.142
0.0%
jan 1, 1962
0.142
0.0
0.0%
jan 1, 1963
0.142
0.0
0.0%
jan 1, 1964
0.142
0.0
0.0%
jan 1, 1965
0.142
0.0
0.0%
jan 1, 1966
0.143
+0.001
0.87%
jan 1, 1967
0.143
0.0
0.0%
jan 1, 1968
0.143
0.0
0.0%
jan 1, 1969
0.143
0.0
0.0%
jan 1, 1970
0.143
0.0
0.0%
jan 1, 1971
0.143
0.0
0.0%
jan 1, 1972
0.141
-0.002
-1.32%
jan 1, 1973
0.135
-0.007
-4.66%
jan 1, 1974
0.122
-0.013
-9.34%
jan 1, 1975
0.127
+0.004
3.6%
jan 1, 1976
0.128
+0.001
0.63%
jan 1, 1977
0.151
+0.023
18.27%
jan 1, 1978
0.191
+0.04
26.59%
jan 1, 1979
0.219
+0.028
14.82%
jan 1, 1980
0.244
+0.025
11.31%
jan 1, 1981
0.25
+0.006
2.34%
jan 1, 1982
0.307
+0.057
22.95%
jan 1, 1983
0.396
+0.089
29.12%
jan 1, 1984
0.553
+0.156
39.4%
jan 1, 1985
0.73
+0.178
32.14%
jan 1, 1986
0.85
+0.12
16.39%
jan 1, 1987
0.746
-0.104
-12.21%
jan 1, 1988
0.703
-0.043
-5.82%
jan 1, 1989
0.718
+0.015
2.18%
jan 1, 1990
0.785
+0.067
9.39%
jan 1, 1991
0.711
-0.074
-9.46%
jan 1, 1992
0.721
+0.01
1.35%
jan 1, 1993
0.673
-0.047
-6.56%
jan 1, 1994
0.802
+0.129
19.11%
jan 1, 1995
0.828
+0.026
3.23%
jan 1, 1996
0.754
-0.074
-8.97%
jan 1, 1997
0.769
+0.016
2.08%
jan 1, 1998
0.875
+0.105
13.66%
jan 1, 1999
0.898
+0.024
2.73%
jan 1, 2000
0.939
+0.04
4.47%
jan 1, 2001
1.085
+0.147
15.64%
jan 1, 2002
1.117
+0.032
2.96%
jan 1, 2003
1.063
-0.055
-4.91%
jan 1, 2004
0.886
-0.177
-16.62%
jan 1, 2005
0.805
-0.081
-9.1%
jan 1, 2006
0.804
-0.001
-0.16%
jan 1, 2007
0.797
-0.007
-0.87%
jan 1, 2008
0.731
-0.067
-8.34%
jan 1, 2009
0.683
-0.048
-6.56%
jan 1, 2010
0.72
+0.037
5.43%
jan 1, 2011
0.755
+0.035
4.89%
jan 1, 2012
0.719
-0.036
-4.72%
jan 1, 2013
0.778
+0.059
8.19%
jan 1, 2014
0.753
-0.025
-3.23%
jan 1, 2015
0.754
+0.001
0.08%
jan 1, 2016
0.902
+0.148
19.63%
Ranking of countries by current statistics by years


Comments: