29
/
en
AIzaSyAYiBZKx7MnpbEhh9jyipgxe19OcubqV5w
April 1, 2024
98426
Cambodia
KHM
true
2
1
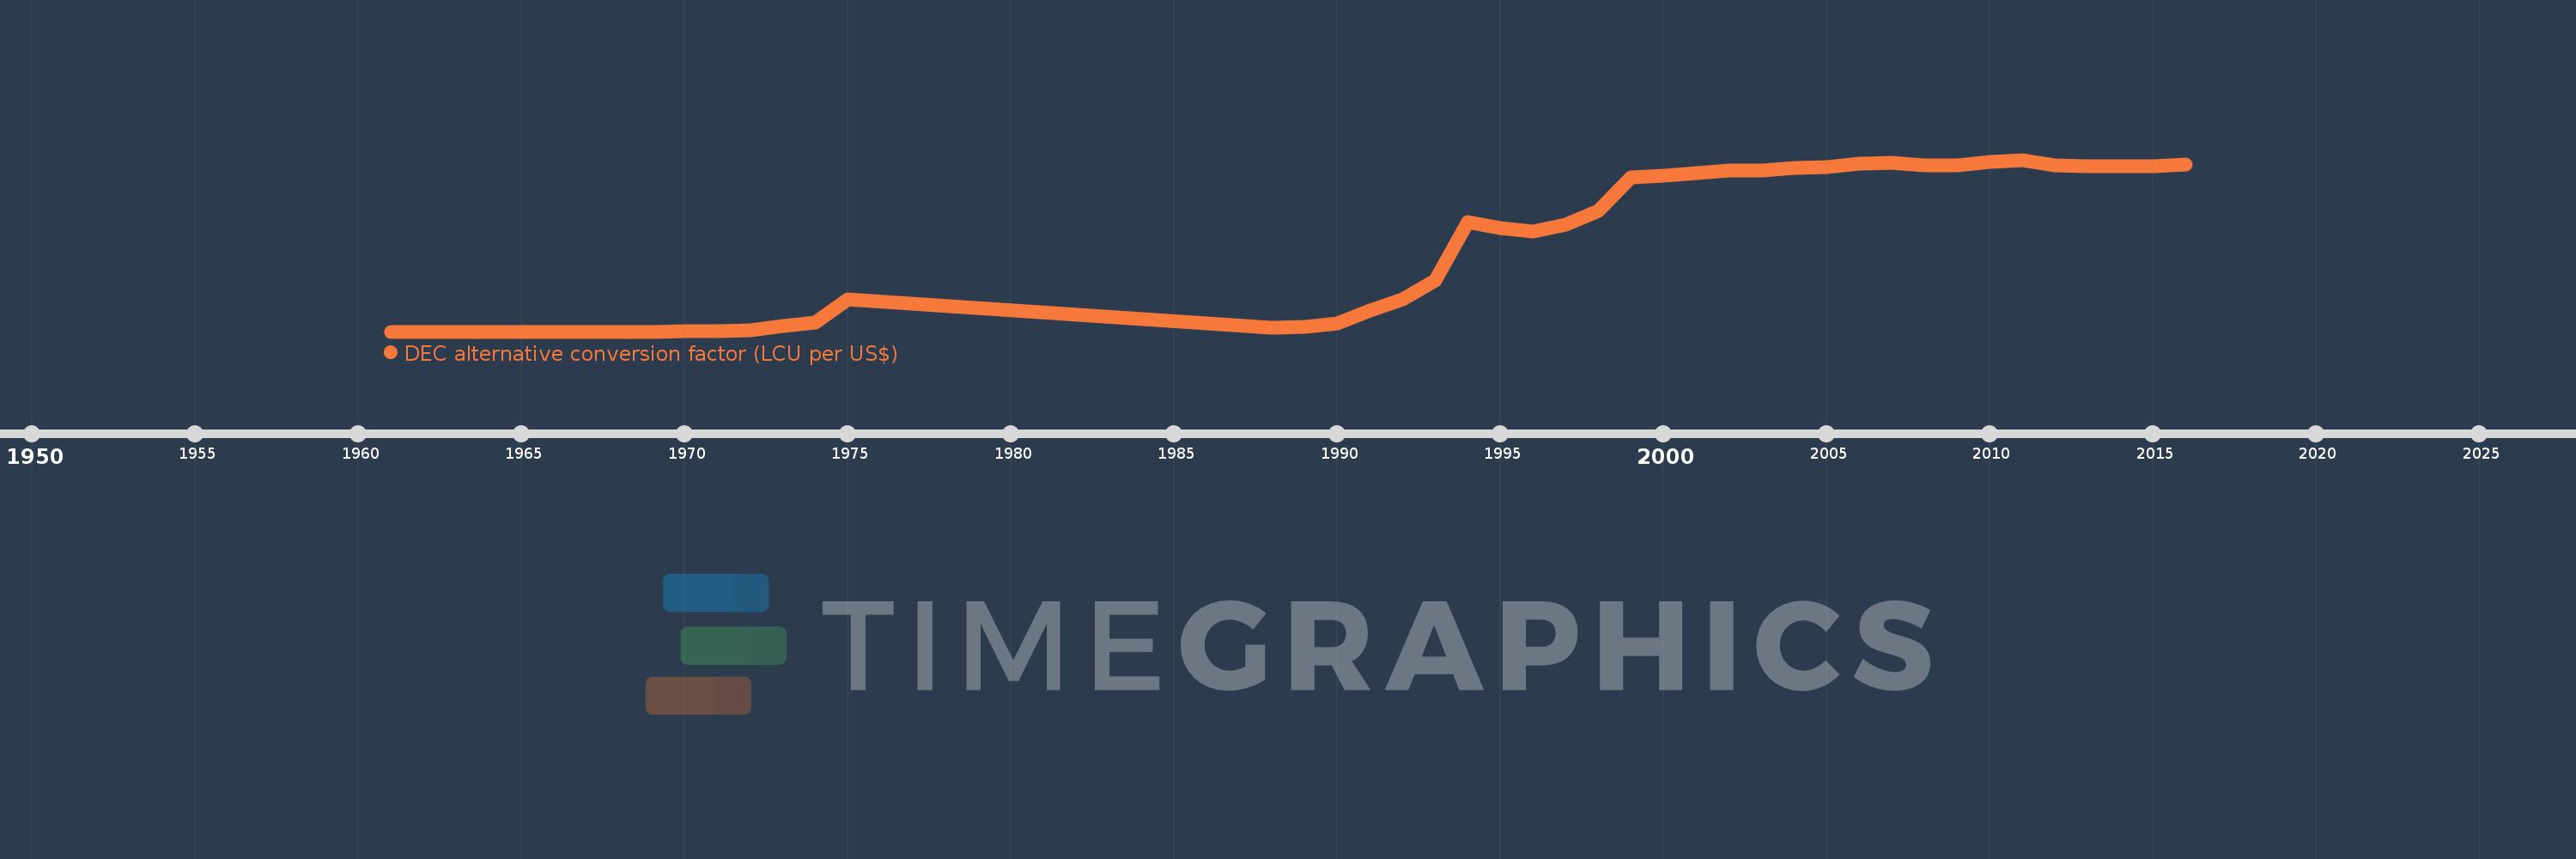
DEC alternative conversion factor (LCU per US$)
2016,2015,2014,2013,2012,2011,2010,2009,2008,2007,2006,2005,2004,2003,2002,2001,2000,1999,1998,1997,1996,1995,1994,1993,1992,1991,1990,1989,1988,1975,1974,1973,1972,1971,1970,1969,1968,1967,1966,1965,1964,1963,1962,1961
This statistics in other country:
AfghanistanAlbaniaAlgeriaAmerican SamoaAndorraAngolaAntigua and BarbudaArgentinaArmeniaArubaAustraliaAustriaAzerbaijanBahamas, TheBahrainBangladeshBarbadosBelarusBelgiumBelizeBeninBermudaBhutanBoliviaBosnia and HerzegovinaBotswanaBrazilBrunei DarussalamBulgariaBurkina FasoBurundiCabo VerdeCambodiaCameroonCanadaCayman IslandsCentral African RepublicChadChannel IslandsChileChinaColombiaComorosCongo, Dem. Rep.Congo, Rep.Costa RicaCote d'IvoireCroatiaCubaCyprusCzech RepublicDenmarkDjiboutiDominicaDominican RepublicEcuadorEgypt, Arab Rep.El SalvadorEquatorial GuineaEritreaEstoniaEthiopiaFaroe IslandsFijiFinlandFranceFrench PolynesiaGabonGambia, TheGeorgiaGermanyGhanaGreeceGreenlandGrenadaGuatemalaGuineaGuinea-BissauGuyanaHaitiHondurasHong Kong SAR, ChinaHungaryIcelandIndiaIndonesiaIran, Islamic Rep.IraqIrelandIsle of ManIsraelItalyJamaicaJapanJordanKazakhstanKenyaKiribatiKorea, Rep.KosovoKuwaitKyrgyz RepublicLao PDRLatviaLebanonLesothoLiberiaLibyaLiechtensteinLithuaniaLuxembourgMacao SAR, ChinaMacedonia, FYRMadagascarMalawiMalaysiaMaldivesMaliMaltaMarshall IslandsMauritaniaMauritiusMexicoMicronesia, Fed. Sts.MoldovaMonacoMongoliaMontenegroMoroccoMozambiqueMyanmarNamibiaNauruNepalNetherlandsNew CaledoniaNew ZealandNicaraguaNigerNigeriaNorwayOmanPakistanPalauPanamaPapua New GuineaParaguayPeruPhilippinesPolandPortugalPuerto RicoQatarRomaniaRussian FederationRwandaSamoaSan MarinoSao Tome and PrincipeSaudi ArabiaSenegalSerbiaSeychellesSierra LeoneSingaporeSlovak RepublicSloveniaSolomon IslandsSomaliaSouth AfricaSouth SudanSpainSri LankaSt. Kitts and NevisSt. LuciaSt. Vincent and the GrenadinesSudanSurinameSwazilandSwedenSwitzerlandSyrian Arab RepublicTajikistanTanzaniaThailandTimor-LesteTogoTongaTrinidad and TobagoTunisiaTurkeyTurkmenistanTuvaluUgandaUkraineUnited Arab EmiratesUnited KingdomUnited StatesUruguayUzbekistanVanuatuVenezuela, RBVietnamVirgin Islands (U.S.)West Bank and GazaYemen, Rep.ZambiaZimbabwe Timeline:
This timeline shows a graph from 1961 to 2016 of Cambodia. No data until 1960. Number of actual observations by date: 44.
Source name:
World Development Indicators
Source organization:
International Monetary Fund, International Financial Statistics, supplemented by World Bank staff estimates.
Categories, topics:
Economy & Growth, Financial Sector
Last updated:
apr 23, 2017
Indicators value changes by year
Maximum:
4.185K
jan 1, 2011
At the date of observation
Value
Absolute change
Change from previous value
jan 1, 1961
35.0
+35.0
0.0%
jan 1, 1970
42.6
+7.6
21.71%
jan 1, 1971
55.54
+12.94
30.38%
jan 1, 1972
71.655
+16.115
29.02%
jan 1, 1973
162.9
+91.245
127.34%
jan 1, 1974
244.9
+82.0
50.34%
jan 1, 1975
804.25
+559.35
228.4%
jan 1, 1988
120.0
-684.25
-85.08%
jan 1, 1989
148.0
+28.0
23.33%
jan 1, 1990
224.0
+76.0
51.35%
jan 1, 1991
537.0
+313.0
139.73%
jan 1, 1992
818.0
+281.0
52.33%
jan 1, 1993
1.267K
+448.6
54.84%
jan 1, 1994
2.689K
+1.422K
112.3%
jan 1, 1995
2.545K
-143.7
-5.34%
jan 1, 1996
2.451K
-94.5
-3.71%
jan 1, 1997
2.624K
+173.3
7.07%
jan 1, 1998
2.946K
+322.2
12.28%
jan 1, 1999
3.756K
+809.7
27.48%
jan 1, 2000
3.803K
+47.0
1.25%
jan 1, 2001
3.854K
+51.0
1.34%
jan 1, 2002
3.924K
+70.0
1.82%
jan 1, 2003
3.917K
-7.0
-0.18%
jan 1, 2004
3.979K
+62.0
1.58%
jan 1, 2005
4.016K
+37.3
0.94%
jan 1, 2006
4.093K
+76.2
1.9%
jan 1, 2007
4.103K
+10.75
0.26%
jan 1, 2008
4.056K
-47.083
-1.15%
jan 1, 2009
4.054K
-2.0
-0.05%
jan 1, 2010
4.139K
+85.167
2.1%
jan 1, 2011
4.185K
+45.583
1.1%
jan 1, 2012
4.059K
-126.417
-3.02%
jan 1, 2013
4.033K
-25.5
-0.63%
jan 1, 2014
4.027K
-5.75
-0.14%
jan 1, 2015
4.037K
+10.25
0.25%
jan 1, 2016
4.068K
+30.25
0.75%
Ranking of countries by current statistics by years


Comments: