29
/
en
AIzaSyAYiBZKx7MnpbEhh9jyipgxe19OcubqV5w
April 1, 2024
230887
Rwanda
RWA
true
2
1
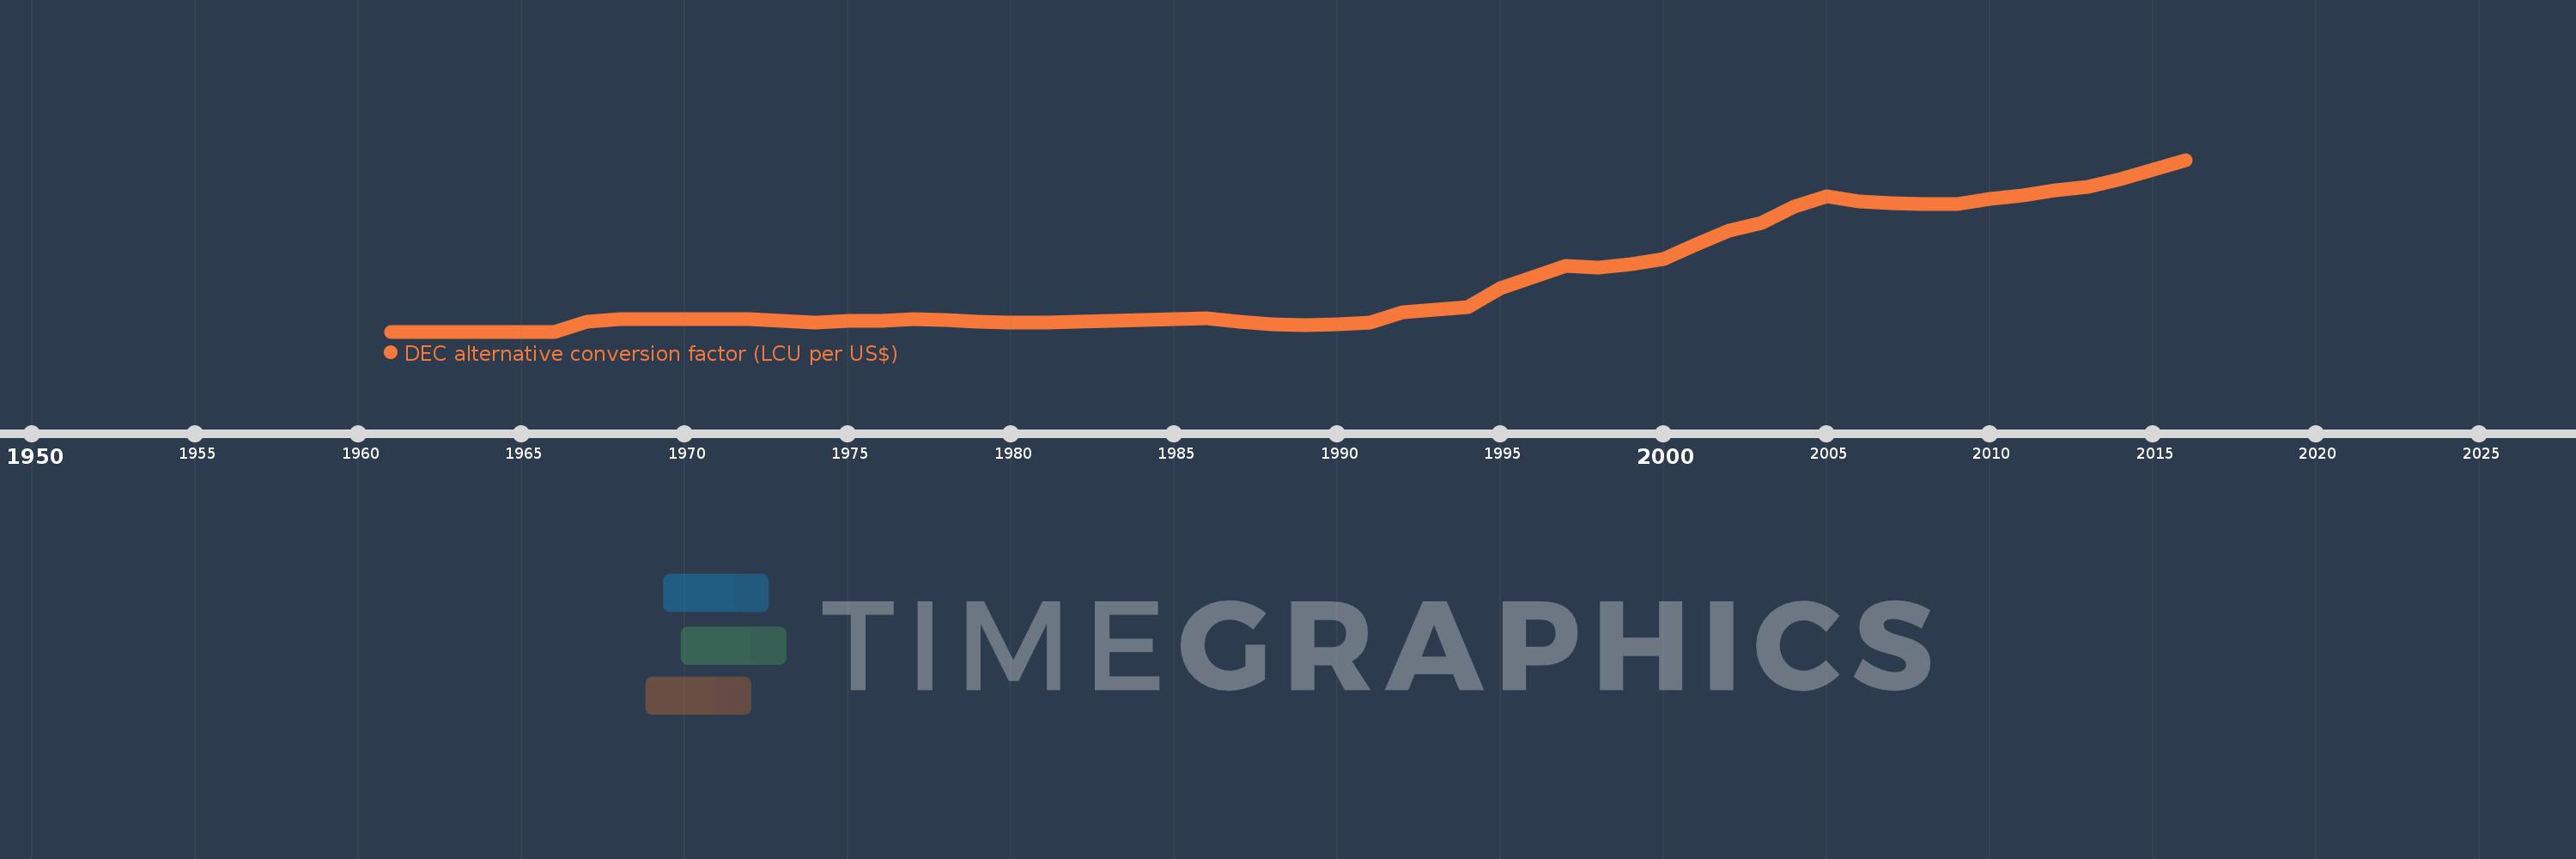
DEC alternative conversion factor (LCU per US$)
2016,2015,2014,2013,2012,2011,2010,2009,2008,2007,2006,2005,2004,2003,2002,2001,2000,1999,1998,1997,1996,1995,1994,1993,1992,1991,1990,1989,1988,1987,1986,1985,1984,1983,1982,1981,1980,1979,1978,1977,1976,1975,1974,1973,1972,1971,1970,1969,1968,1967,1966,1965,1964,1963,1962,1961
This statistics in other country:
AfghanistanAlbaniaAlgeriaAmerican SamoaAndorraAngolaAntigua and BarbudaArgentinaArmeniaArubaAustraliaAustriaAzerbaijanBahamas, TheBahrainBangladeshBarbadosBelarusBelgiumBelizeBeninBermudaBhutanBoliviaBosnia and HerzegovinaBotswanaBrazilBrunei DarussalamBulgariaBurkina FasoBurundiCabo VerdeCambodiaCameroonCanadaCayman IslandsCentral African RepublicChadChannel IslandsChileChinaColombiaComorosCongo, Dem. Rep.Congo, Rep.Costa RicaCote d'IvoireCroatiaCubaCyprusCzech RepublicDenmarkDjiboutiDominicaDominican RepublicEcuadorEgypt, Arab Rep.El SalvadorEquatorial GuineaEritreaEstoniaEthiopiaFaroe IslandsFijiFinlandFranceFrench PolynesiaGabonGambia, TheGeorgiaGermanyGhanaGreeceGreenlandGrenadaGuatemalaGuineaGuinea-BissauGuyanaHaitiHondurasHong Kong SAR, ChinaHungaryIcelandIndiaIndonesiaIran, Islamic Rep.IraqIrelandIsle of ManIsraelItalyJamaicaJapanJordanKazakhstanKenyaKiribatiKorea, Rep.KosovoKuwaitKyrgyz RepublicLao PDRLatviaLebanonLesothoLiberiaLibyaLiechtensteinLithuaniaLuxembourgMacao SAR, ChinaMacedonia, FYRMadagascarMalawiMalaysiaMaldivesMaliMaltaMarshall IslandsMauritaniaMauritiusMexicoMicronesia, Fed. Sts.MoldovaMonacoMongoliaMontenegroMoroccoMozambiqueMyanmarNamibiaNauruNepalNetherlandsNew CaledoniaNew ZealandNicaraguaNigerNigeriaNorwayOmanPakistanPalauPanamaPapua New GuineaParaguayPeruPhilippinesPolandPortugalPuerto RicoQatarRomaniaRussian FederationRwandaSamoaSan MarinoSao Tome and PrincipeSaudi ArabiaSenegalSerbiaSeychellesSierra LeoneSingaporeSlovak RepublicSloveniaSolomon IslandsSomaliaSouth AfricaSouth SudanSpainSri LankaSt. Kitts and NevisSt. LuciaSt. Vincent and the GrenadinesSudanSurinameSwazilandSwedenSwitzerlandSyrian Arab RepublicTajikistanTanzaniaThailandTimor-LesteTogoTongaTrinidad and TobagoTunisiaTurkeyTurkmenistanTuvaluUgandaUkraineUnited Arab EmiratesUnited KingdomUnited StatesUruguayUzbekistanVanuatuVenezuela, RBVietnamVirgin Islands (U.S.)West Bank and GazaYemen, Rep.ZambiaZimbabwe Timeline:
This timeline shows a graph from 1961 to 2016 of Rwanda. No data until 1960. Number of actual observations by date: 56.
Source name:
World Development Indicators
Source organization:
International Monetary Fund, International Financial Statistics, supplemented by World Bank staff estimates.
Categories, topics:
Economy & Growth, Financial Sector
Last updated:
apr 23, 2017
Indicators value changes by year
Maximum:
720.975
jan 1, 2016
At the date of observation
Value
Absolute change
Change from previous value
jan 1, 1961
50.0
+50.0
0.0%
jan 1, 1967
87.5
+37.5
75.0%
jan 1, 1968
100.0
+12.5
14.29%
jan 1, 1969
100.0
0.0
0.0%
jan 1, 1970
100.0
0.0
0.0%
jan 1, 1971
100.0
0.0
0.0%
jan 1, 1972
99.707
-0.293
-0.29%
jan 1, 1973
92.105
-7.602
-7.62%
jan 1, 1974
83.922
-8.183
-8.88%
jan 1, 1975
92.978
+9.056
10.79%
jan 1, 1976
92.277
-0.701
-0.75%
jan 1, 1977
97.012
+4.735
5.13%
jan 1, 1978
95.935
-1.077
-1.11%
jan 1, 1979
89.488
-6.447
-6.72%
jan 1, 1980
86.691
-2.797
-3.13%
jan 1, 1981
86.064
-0.627
-0.72%
jan 1, 1982
87.16
+1.096
1.27%
jan 1, 1983
93.06
+5.9
6.77%
jan 1, 1984
96.094
+3.034
3.26%
jan 1, 1985
100.233
+4.139
4.31%
jan 1, 1986
101.245
+1.012
1.01%
jan 1, 1987
87.591
-13.654
-13.49%
jan 1, 1988
79.461
-8.13
-9.28%
jan 1, 1989
76.448
-3.013
-3.79%
jan 1, 1990
80.149
+3.701
4.84%
jan 1, 1991
83.704
+3.555
4.44%
jan 1, 1992
125.164
+41.46
49.53%
jan 1, 1993
133.939
+8.774
7.01%
jan 1, 1994
144.237
+10.298
7.69%
jan 1, 1995
220.0
+75.763
52.53%
jan 1, 1996
262.182
+42.182
19.17%
jan 1, 1997
306.82
+44.638
17.03%
jan 1, 1998
301.53
-5.29
-1.72%
jan 1, 1999
312.314
+10.784
3.58%
jan 1, 2000
333.942
+21.628
6.93%
jan 1, 2001
389.696
+55.754
16.7%
jan 1, 2002
442.992
+53.296
13.68%
jan 1, 2003
475.365
+32.373
7.31%
jan 1, 2004
537.655
+62.29
13.1%
jan 1, 2005
577.449
+39.794
7.4%
jan 1, 2006
557.823
-19.626
-3.4%
jan 1, 2007
551.71
-6.112
-1.1%
jan 1, 2008
546.955
-4.755
-0.86%
jan 1, 2009
546.849
-0.106
-0.02%
jan 1, 2010
568.281
+21.433
3.92%
jan 1, 2011
583.131
+14.85
2.61%
jan 1, 2012
600.307
+17.176
2.95%
jan 1, 2013
614.295
+13.989
2.33%
jan 1, 2014
646.636
+32.341
5.26%
jan 1, 2015
681.862
+35.226
5.45%
jan 1, 2016
720.975
+39.113
5.74%
Ranking of countries by current statistics by years


Comments: