29
/
en
AIzaSyAYiBZKx7MnpbEhh9jyipgxe19OcubqV5w
April 1, 2024
181946
Luxembourg
LUX
true
2
1
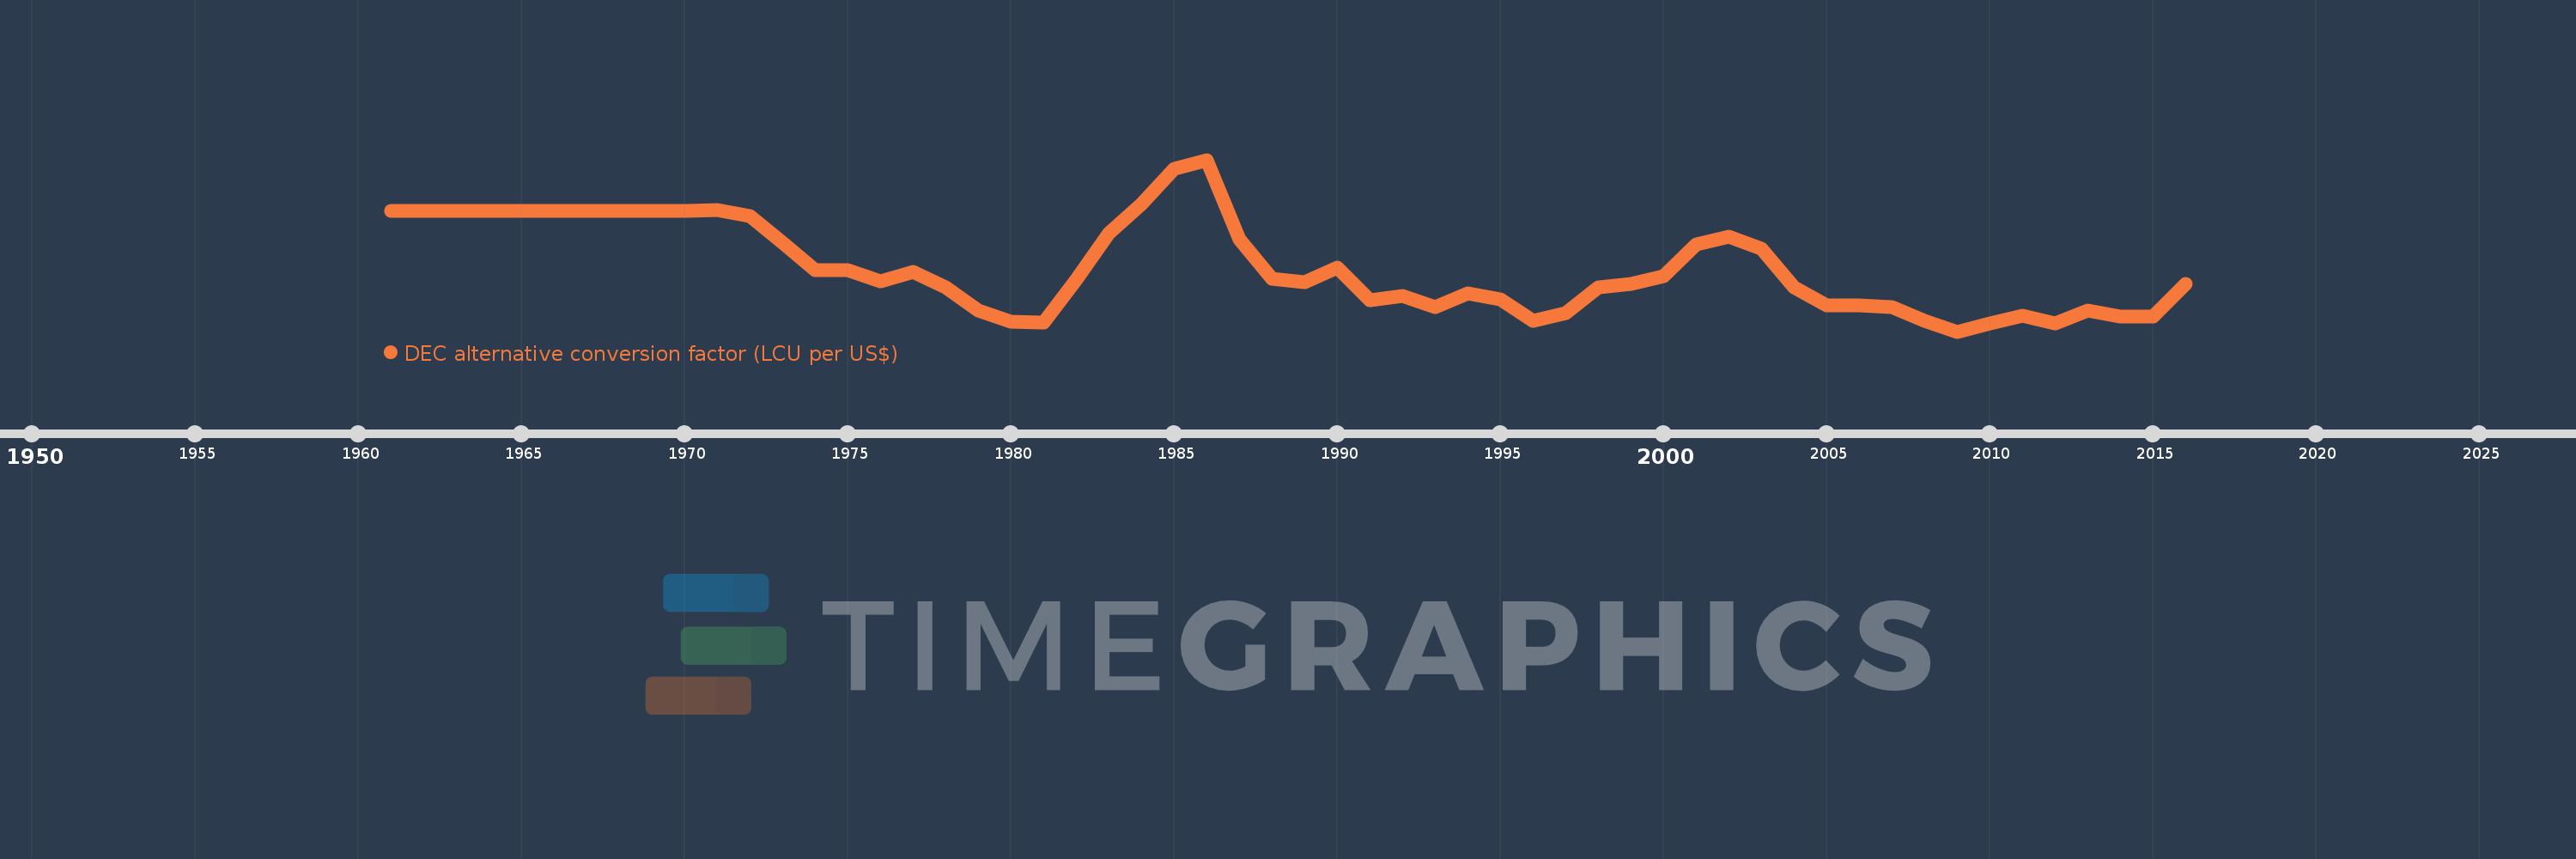
DEC alternative conversion factor (LCU per US$)
2016,2015,2014,2013,2012,2011,2010,2009,2008,2007,2006,2005,2004,2003,2002,2001,2000,1999,1998,1997,1996,1995,1994,1993,1992,1991,1990,1989,1988,1987,1986,1985,1984,1983,1982,1981,1980,1979,1978,1977,1976,1975,1974,1973,1972,1971,1970,1969,1968,1967,1966,1965,1964,1963,1962,1961
This statistics in other country:
AfghanistanAlbaniaAlgeriaAmerican SamoaAndorraAngolaAntigua and BarbudaArgentinaArmeniaArubaAustraliaAustriaAzerbaijanBahamas, TheBahrainBangladeshBarbadosBelarusBelgiumBelizeBeninBermudaBhutanBoliviaBosnia and HerzegovinaBotswanaBrazilBrunei DarussalamBulgariaBurkina FasoBurundiCabo VerdeCambodiaCameroonCanadaCayman IslandsCentral African RepublicChadChannel IslandsChileChinaColombiaComorosCongo, Dem. Rep.Congo, Rep.Costa RicaCote d'IvoireCroatiaCubaCyprusCzech RepublicDenmarkDjiboutiDominicaDominican RepublicEcuadorEgypt, Arab Rep.El SalvadorEquatorial GuineaEritreaEstoniaEthiopiaFaroe IslandsFijiFinlandFranceFrench PolynesiaGabonGambia, TheGeorgiaGermanyGhanaGreeceGreenlandGrenadaGuatemalaGuineaGuinea-BissauGuyanaHaitiHondurasHong Kong SAR, ChinaHungaryIcelandIndiaIndonesiaIran, Islamic Rep.IraqIrelandIsle of ManIsraelItalyJamaicaJapanJordanKazakhstanKenyaKiribatiKorea, Rep.KosovoKuwaitKyrgyz RepublicLao PDRLatviaLebanonLesothoLiberiaLibyaLiechtensteinLithuaniaLuxembourgMacao SAR, ChinaMacedonia, FYRMadagascarMalawiMalaysiaMaldivesMaliMaltaMarshall IslandsMauritaniaMauritiusMexicoMicronesia, Fed. Sts.MoldovaMonacoMongoliaMontenegroMoroccoMozambiqueMyanmarNamibiaNauruNepalNetherlandsNew CaledoniaNew ZealandNicaraguaNigerNigeriaNorwayOmanPakistanPalauPanamaPapua New GuineaParaguayPeruPhilippinesPolandPortugalPuerto RicoQatarRomaniaRussian FederationRwandaSamoaSan MarinoSao Tome and PrincipeSaudi ArabiaSenegalSerbiaSeychellesSierra LeoneSingaporeSlovak RepublicSloveniaSolomon IslandsSomaliaSouth AfricaSouth SudanSpainSri LankaSt. Kitts and NevisSt. LuciaSt. Vincent and the GrenadinesSudanSurinameSwazilandSwedenSwitzerlandSyrian Arab RepublicTajikistanTanzaniaThailandTimor-LesteTogoTongaTrinidad and TobagoTunisiaTurkeyTurkmenistanTuvaluUgandaUkraineUnited Arab EmiratesUnited KingdomUnited StatesUruguayUzbekistanVanuatuVenezuela, RBVietnamVirgin Islands (U.S.)West Bank and GazaYemen, Rep.ZambiaZimbabwe Timeline:
This timeline shows a graph from 1961 to 2016 of Luxembourg. No data until 1960. Number of actual observations by date: 56.
Source name:
World Development Indicators
Source organization:
International Monetary Fund, International Financial Statistics, supplemented by World Bank staff estimates.
Categories, topics:
Economy & Growth, Financial Sector
Last updated:
apr 23, 2017
Indicators value changes by year
At the date of observation
Value
Absolute change
Change from previous value
jan 1, 1961
1.239
+1.239
0.0%
jan 1, 1962
1.239
0.0
0.0%
jan 1, 1963
1.239
0.0
0.0%
jan 1, 1964
1.239
0.0
0.0%
jan 1, 1965
1.239
0.0
0.0%
jan 1, 1966
1.239
0.0
0.0%
jan 1, 1967
1.239
0.0
0.0%
jan 1, 1968
1.239
0.0
0.0%
jan 1, 1969
1.239
0.0
0.0%
jan 1, 1970
1.239
0.0
0.0%
jan 1, 1971
1.24
+0.0
0.0%
jan 1, 1972
1.212
-0.028
-2.26%
jan 1, 1973
1.091
-0.12
-9.94%
jan 1, 1974
0.966
-0.125
-11.45%
jan 1, 1975
0.966
-0.001
-0.06%
jan 1, 1976
0.912
-0.054
-5.58%
jan 1, 1977
0.957
+0.045
4.97%
jan 1, 1978
0.888
-0.069
-7.16%
jan 1, 1979
0.781
-0.108
-12.13%
jan 1, 1980
0.727
-0.054
-6.9%
jan 1, 1981
0.725
-0.002
-0.26%
jan 1, 1982
0.92
+0.196
26.97%
jan 1, 1983
1.133
+0.212
23.06%
jan 1, 1984
1.268
+0.135
11.91%
jan 1, 1985
1.432
+0.165
13.01%
jan 1, 1986
1.472
+0.04
2.76%
jan 1, 1987
1.107
-0.365
-24.76%
jan 1, 1988
0.925
-0.182
-16.43%
jan 1, 1989
0.911
-0.014
-1.51%
jan 1, 1990
0.977
+0.065
7.16%
jan 1, 1991
0.828
-0.148
-15.19%
jan 1, 1992
0.847
+0.018
2.18%
jan 1, 1993
0.797
-0.049
-5.85%
jan 1, 1994
0.858
+0.061
7.6%
jan 1, 1995
0.829
-0.028
-3.29%
jan 1, 1996
0.731
-0.099
-11.89%
jan 1, 1997
0.767
+0.037
5.02%
jan 1, 1998
0.887
+0.119
15.54%
jan 1, 1999
0.9
+0.013
1.47%
jan 1, 2000
0.939
+0.039
4.31%
jan 1, 2001
1.085
+0.147
15.64%
jan 1, 2002
1.117
+0.032
2.96%
jan 1, 2003
1.063
-0.055
-4.91%
jan 1, 2004
0.886
-0.177
-16.62%
jan 1, 2005
0.805
-0.081
-9.1%
jan 1, 2006
0.804
-0.001
-0.16%
jan 1, 2007
0.797
-0.007
-0.87%
jan 1, 2008
0.731
-0.067
-8.34%
jan 1, 2009
0.683
-0.048
-6.56%
jan 1, 2010
0.72
+0.037
5.43%
jan 1, 2011
0.755
+0.035
4.89%
jan 1, 2012
0.719
-0.036
-4.72%
jan 1, 2013
0.778
+0.059
8.19%
jan 1, 2014
0.753
-0.025
-3.23%
jan 1, 2015
0.754
+0.001
0.08%
jan 1, 2016
0.902
+0.148
19.63%
Ranking of countries by current statistics by years


Comments: