29
/
en
AIzaSyAYiBZKx7MnpbEhh9jyipgxe19OcubqV5w
April 1, 2024
146726
Guinea-Bissau
GNB
true
2
1
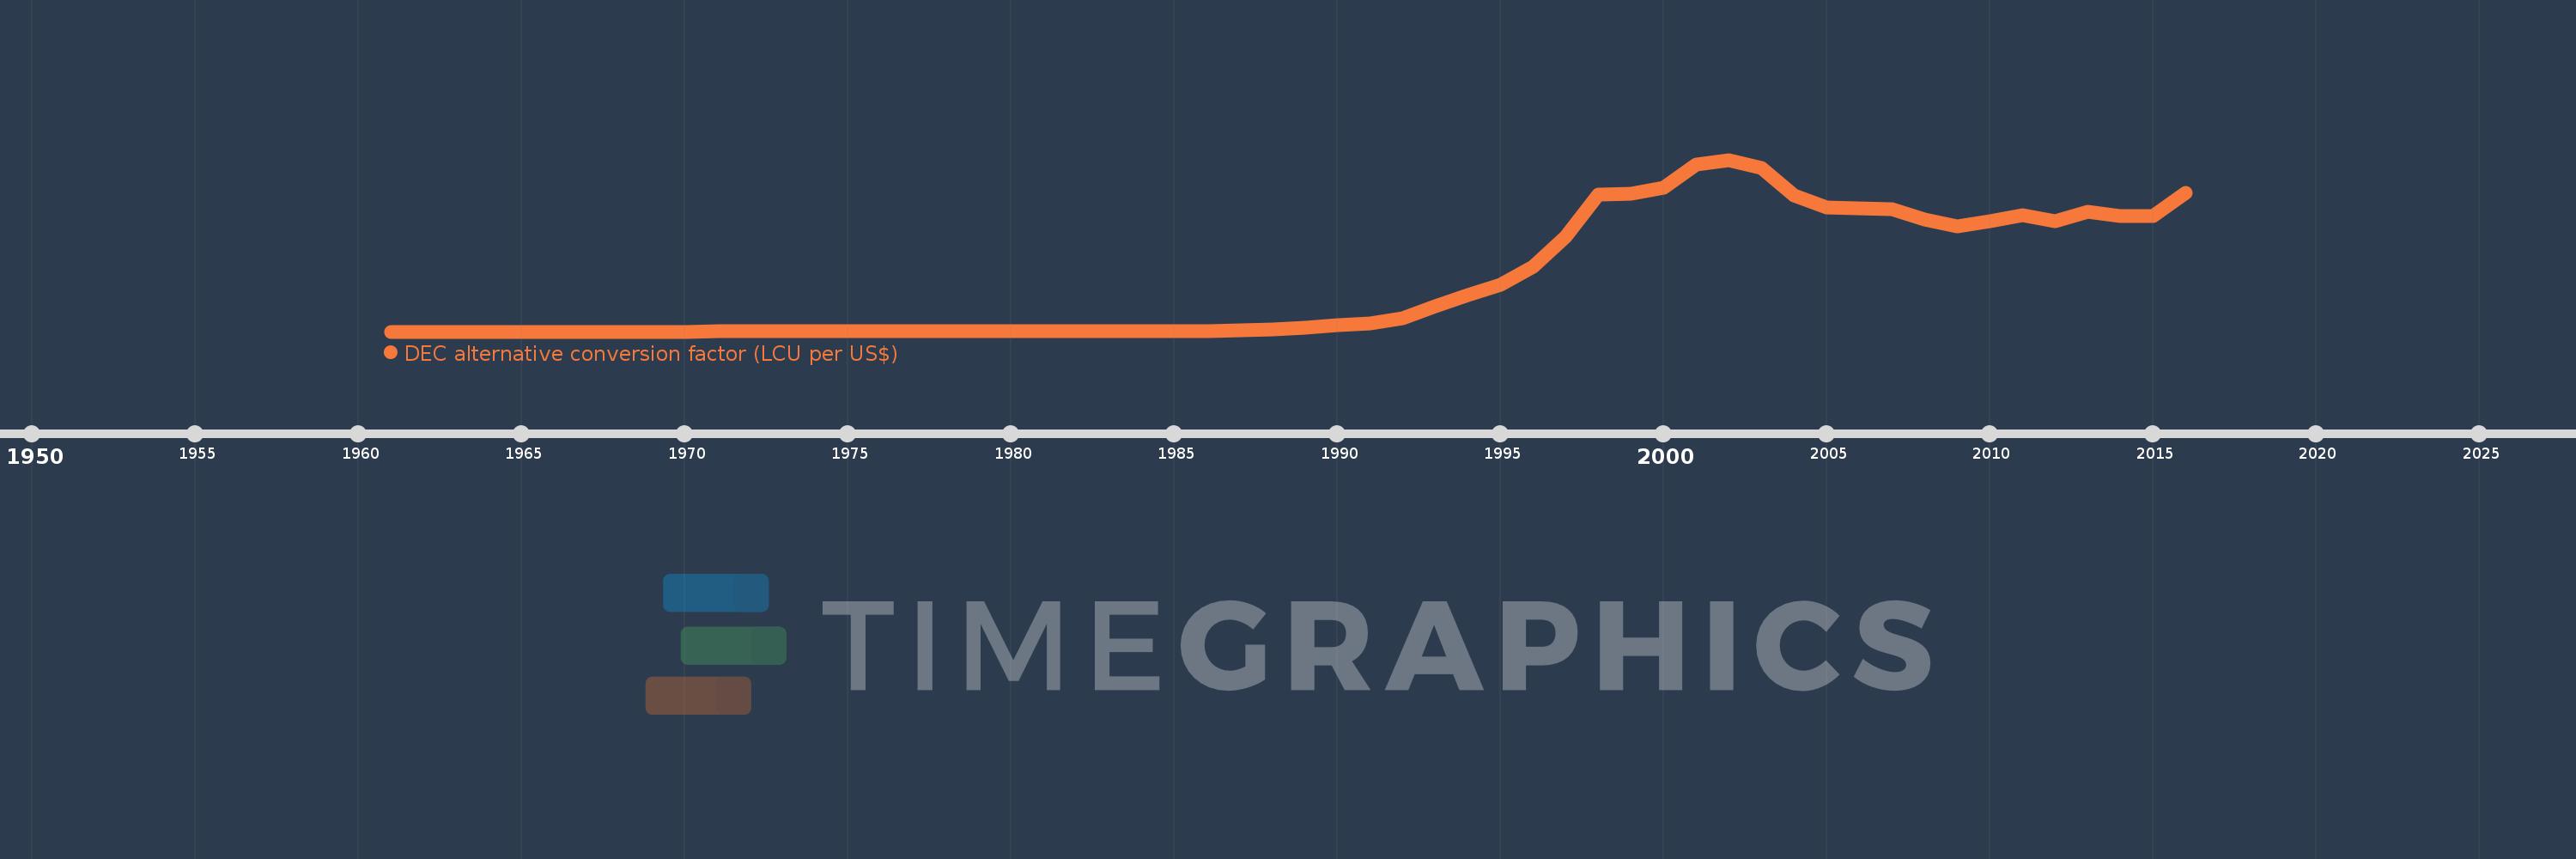
DEC alternative conversion factor (LCU per US$)
2016,2015,2014,2013,2012,2011,2010,2009,2008,2007,2006,2005,2004,2003,2002,2001,2000,1999,1998,1997,1996,1995,1994,1993,1992,1991,1990,1989,1988,1987,1986,1985,1984,1983,1982,1981,1980,1979,1978,1977,1976,1975,1974,1973,1972,1971,1970,1969,1968,1967,1966,1965,1964,1963,1962,1961
This statistics in other country:
AfghanistanAlbaniaAlgeriaAmerican SamoaAndorraAngolaAntigua and BarbudaArgentinaArmeniaArubaAustraliaAustriaAzerbaijanBahamas, TheBahrainBangladeshBarbadosBelarusBelgiumBelizeBeninBermudaBhutanBoliviaBosnia and HerzegovinaBotswanaBrazilBrunei DarussalamBulgariaBurkina FasoBurundiCabo VerdeCambodiaCameroonCanadaCayman IslandsCentral African RepublicChadChannel IslandsChileChinaColombiaComorosCongo, Dem. Rep.Congo, Rep.Costa RicaCote d'IvoireCroatiaCubaCyprusCzech RepublicDenmarkDjiboutiDominicaDominican RepublicEcuadorEgypt, Arab Rep.El SalvadorEquatorial GuineaEritreaEstoniaEthiopiaFaroe IslandsFijiFinlandFranceFrench PolynesiaGabonGambia, TheGeorgiaGermanyGhanaGreeceGreenlandGrenadaGuatemalaGuineaGuinea-BissauGuyanaHaitiHondurasHong Kong SAR, ChinaHungaryIcelandIndiaIndonesiaIran, Islamic Rep.IraqIrelandIsle of ManIsraelItalyJamaicaJapanJordanKazakhstanKenyaKiribatiKorea, Rep.KosovoKuwaitKyrgyz RepublicLao PDRLatviaLebanonLesothoLiberiaLibyaLiechtensteinLithuaniaLuxembourgMacao SAR, ChinaMacedonia, FYRMadagascarMalawiMalaysiaMaldivesMaliMaltaMarshall IslandsMauritaniaMauritiusMexicoMicronesia, Fed. Sts.MoldovaMonacoMongoliaMontenegroMoroccoMozambiqueMyanmarNamibiaNauruNepalNetherlandsNew CaledoniaNew ZealandNicaraguaNigerNigeriaNorwayOmanPakistanPalauPanamaPapua New GuineaParaguayPeruPhilippinesPolandPortugalPuerto RicoQatarRomaniaRussian FederationRwandaSamoaSan MarinoSao Tome and PrincipeSaudi ArabiaSenegalSerbiaSeychellesSierra LeoneSingaporeSlovak RepublicSloveniaSolomon IslandsSomaliaSouth AfricaSouth SudanSpainSri LankaSt. Kitts and NevisSt. LuciaSt. Vincent and the GrenadinesSudanSurinameSwazilandSwedenSwitzerlandSyrian Arab RepublicTajikistanTanzaniaThailandTimor-LesteTogoTongaTrinidad and TobagoTunisiaTurkeyTurkmenistanTuvaluUgandaUkraineUnited Arab EmiratesUnited KingdomUnited StatesUruguayUzbekistanVanuatuVenezuela, RBVietnamVirgin Islands (U.S.)West Bank and GazaYemen, Rep.ZambiaZimbabwe Timeline:
This timeline shows a graph from 1961 to 2016 of Guinea-Bissau. No data until 1960. Number of actual observations by date: 56.
Source name:
World Development Indicators
Source organization:
International Monetary Fund, International Financial Statistics, supplemented by World Bank staff estimates.
Categories, topics:
Economy & Growth, Financial Sector
Last updated:
apr 23, 2017
Indicators value changes by year
Maximum:
733.039
jan 1, 2002
At the date of observation
Value
Absolute change
Change from previous value
jan 1, 1961
0.442
+0.442
0.0%
jan 1, 1962
0.442
0.0
0.0%
jan 1, 1963
0.442
0.0
0.0%
jan 1, 1964
0.442
0.0
0.0%
jan 1, 1965
0.442
0.0
0.0%
jan 1, 1966
0.442
0.0
0.0%
jan 1, 1967
0.442
0.0
0.0%
jan 1, 1968
0.442
0.0
0.0%
jan 1, 1969
0.442
0.0
0.0%
jan 1, 1970
0.442
0.0
0.0%
jan 1, 1971
0.549
+0.107
24.14%
jan 1, 1972
0.538
-0.011
-1.93%
jan 1, 1973
0.538
0.0
0.0%
jan 1, 1974
0.59
+0.052
9.57%
jan 1, 1975
0.608
+0.018
3.05%
jan 1, 1976
0.637
+0.029
4.78%
jan 1, 1977
0.658
+0.021
3.31%
jan 1, 1978
0.616
-0.043
-6.47%
jan 1, 1979
0.694
+0.078
12.75%
jan 1, 1980
0.764
+0.07
10.06%
jan 1, 1981
0.767
+0.003
0.42%
jan 1, 1982
0.66
-0.107
-13.96%
jan 1, 1983
0.749
+0.089
13.52%
jan 1, 1984
0.903
+0.154
20.53%
jan 1, 1985
1.855
+0.952
105.44%
jan 1, 1986
2.462
+0.606
32.67%
jan 1, 1987
5.743
+3.282
133.31%
jan 1, 1988
8.6
+2.857
49.75%
jan 1, 1989
17.072
+8.472
98.51%
jan 1, 1990
27.848
+10.776
63.12%
jan 1, 1991
33.622
+5.774
20.73%
jan 1, 1992
56.286
+22.664
67.41%
jan 1, 1993
106.676
+50.389
89.52%
jan 1, 1994
155.106
+48.431
45.4%
jan 1, 1995
198.341
+43.234
27.87%
jan 1, 1996
278.039
+79.698
40.18%
jan 1, 1997
405.745
+127.706
45.93%
jan 1, 1998
583.669
+177.924
43.85%
jan 1, 1999
589.952
+6.282
1.08%
jan 1, 2000
615.699
+25.747
4.36%
jan 1, 2001
711.976
+96.277
15.64%
jan 1, 2002
733.039
+21.062
2.96%
jan 1, 2003
696.988
-36.05
-4.92%
jan 1, 2004
581.2
-115.788
-16.61%
jan 1, 2005
528.285
-52.916
-9.1%
jan 1, 2006
527.468
-0.817
-0.15%
jan 1, 2007
522.89
-4.578
-0.87%
jan 1, 2008
479.267
-43.623
-8.34%
jan 1, 2009
447.805
-31.462
-6.56%
jan 1, 2010
472.186
+24.381
5.44%
jan 1, 2011
495.277
+23.091
4.89%
jan 1, 2012
471.866
-23.411
-4.73%
jan 1, 2013
510.527
+38.661
8.19%
jan 1, 2014
494.04
-16.487
-3.23%
jan 1, 2015
494.415
+0.375
0.08%
jan 1, 2016
591.45
+97.035
19.63%
Ranking of countries by current statistics by years


Comments: