29
/
en
AIzaSyAYiBZKx7MnpbEhh9jyipgxe19OcubqV5w
April 1, 2024
186357
Malawi
MWI
true
2
1
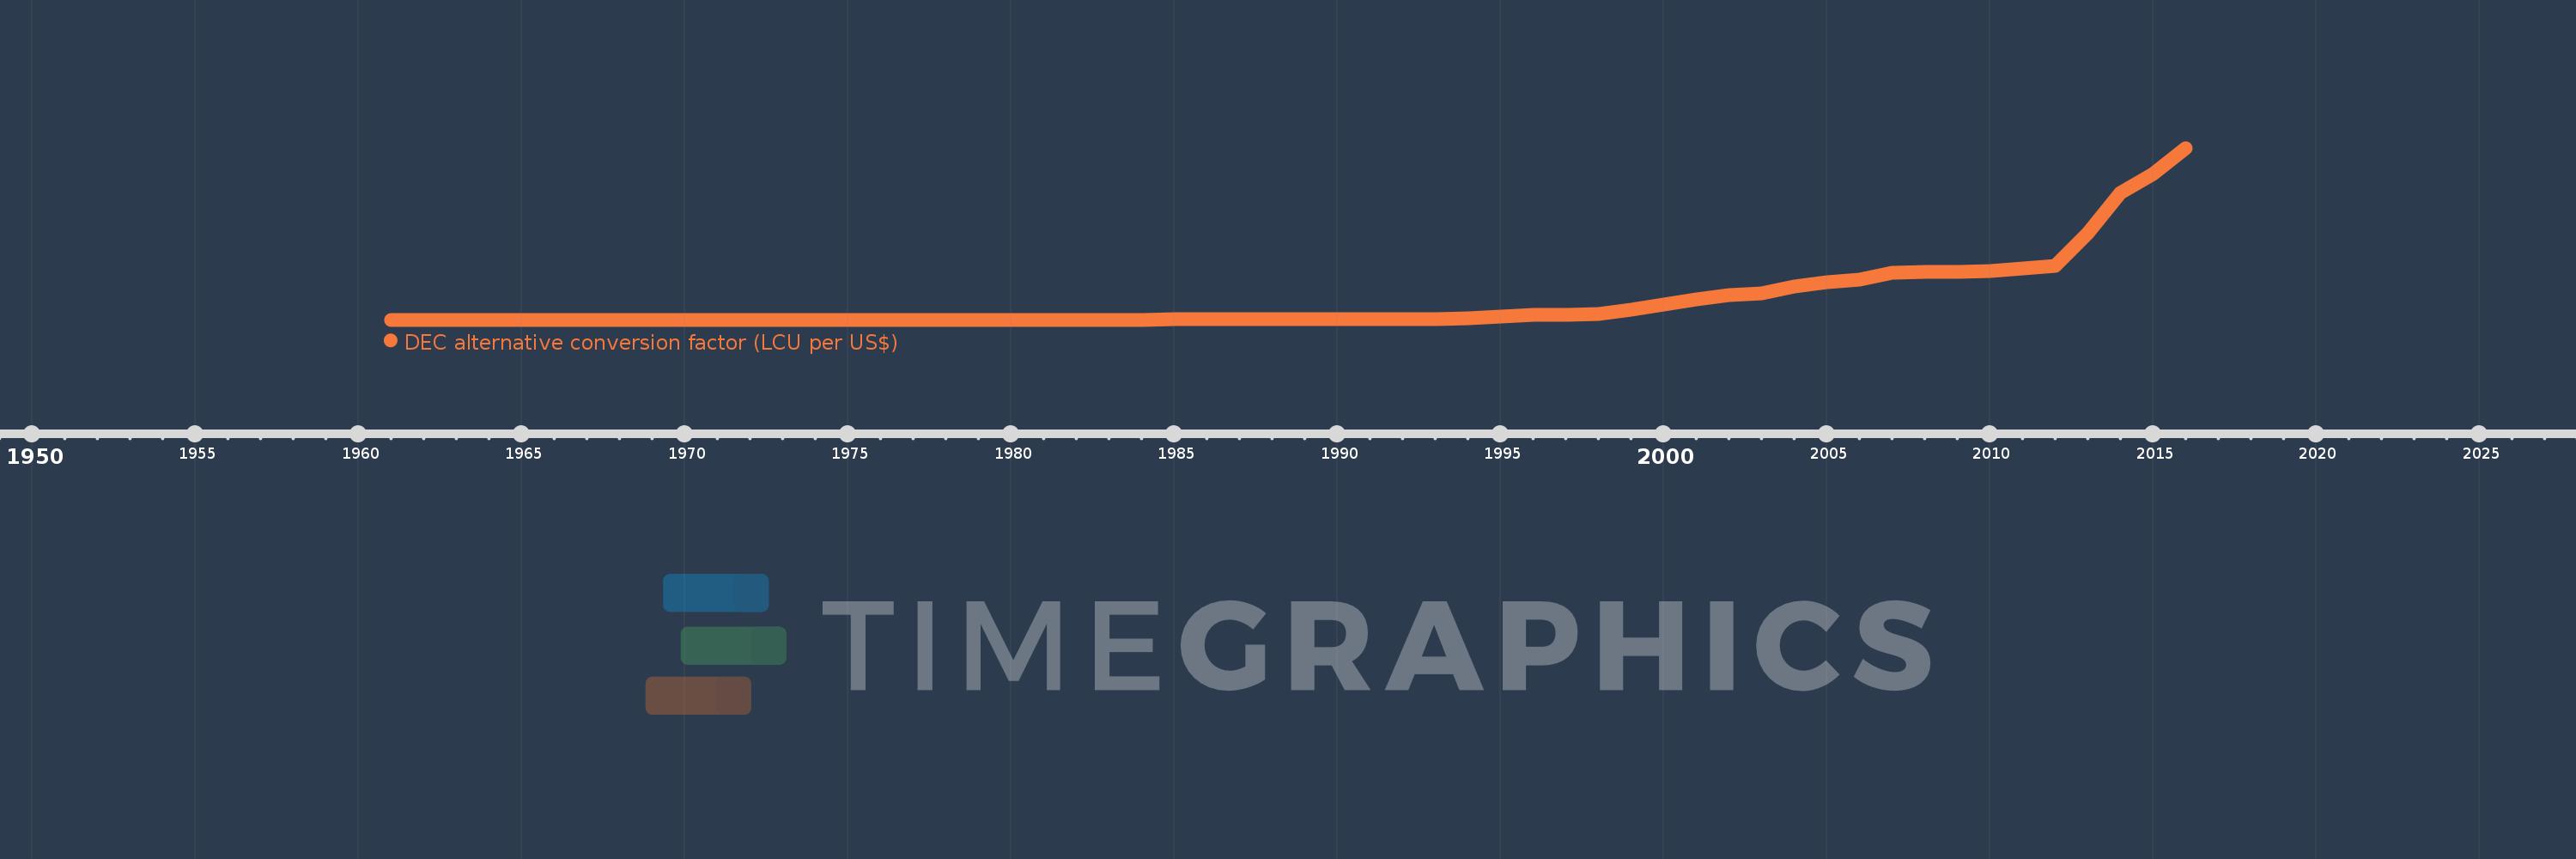
DEC alternative conversion factor (LCU per US$)
2016,2015,2014,2013,2012,2011,2010,2009,2008,2007,2006,2005,2004,2003,2002,2001,2000,1999,1998,1997,1996,1995,1994,1993,1992,1991,1990,1989,1988,1987,1986,1985,1984,1983,1982,1981,1980,1979,1978,1977,1976,1975,1974,1973,1972,1971,1970,1969,1968,1967,1966,1965,1964,1963,1962,1961
This statistics in other country:
AfghanistanAlbaniaAlgeriaAmerican SamoaAndorraAngolaAntigua and BarbudaArgentinaArmeniaArubaAustraliaAustriaAzerbaijanBahamas, TheBahrainBangladeshBarbadosBelarusBelgiumBelizeBeninBermudaBhutanBoliviaBosnia and HerzegovinaBotswanaBrazilBrunei DarussalamBulgariaBurkina FasoBurundiCabo VerdeCambodiaCameroonCanadaCayman IslandsCentral African RepublicChadChannel IslandsChileChinaColombiaComorosCongo, Dem. Rep.Congo, Rep.Costa RicaCote d'IvoireCroatiaCubaCyprusCzech RepublicDenmarkDjiboutiDominicaDominican RepublicEcuadorEgypt, Arab Rep.El SalvadorEquatorial GuineaEritreaEstoniaEthiopiaFaroe IslandsFijiFinlandFranceFrench PolynesiaGabonGambia, TheGeorgiaGermanyGhanaGreeceGreenlandGrenadaGuatemalaGuineaGuinea-BissauGuyanaHaitiHondurasHong Kong SAR, ChinaHungaryIcelandIndiaIndonesiaIran, Islamic Rep.IraqIrelandIsle of ManIsraelItalyJamaicaJapanJordanKazakhstanKenyaKiribatiKorea, Rep.KosovoKuwaitKyrgyz RepublicLao PDRLatviaLebanonLesothoLiberiaLibyaLiechtensteinLithuaniaLuxembourgMacao SAR, ChinaMacedonia, FYRMadagascarMalawiMalaysiaMaldivesMaliMaltaMarshall IslandsMauritaniaMauritiusMexicoMicronesia, Fed. Sts.MoldovaMonacoMongoliaMontenegroMoroccoMozambiqueMyanmarNamibiaNauruNepalNetherlandsNew CaledoniaNew ZealandNicaraguaNigerNigeriaNorwayOmanPakistanPalauPanamaPapua New GuineaParaguayPeruPhilippinesPolandPortugalPuerto RicoQatarRomaniaRussian FederationRwandaSamoaSan MarinoSao Tome and PrincipeSaudi ArabiaSenegalSerbiaSeychellesSierra LeoneSingaporeSlovak RepublicSloveniaSolomon IslandsSomaliaSouth AfricaSouth SudanSpainSri LankaSt. Kitts and NevisSt. LuciaSt. Vincent and the GrenadinesSudanSurinameSwazilandSwedenSwitzerlandSyrian Arab RepublicTajikistanTanzaniaThailandTimor-LesteTogoTongaTrinidad and TobagoTunisiaTurkeyTurkmenistanTuvaluUgandaUkraineUnited Arab EmiratesUnited KingdomUnited StatesUruguayUzbekistanVanuatuVenezuela, RBVietnamVirgin Islands (U.S.)West Bank and GazaYemen, Rep.ZambiaZimbabwe Timeline:
This timeline shows a graph from 1961 to 2016 of Malawi. No data until 1960. Number of actual observations by date: 56.
Source name:
World Development Indicators
Source organization:
International Monetary Fund, International Financial Statistics, supplemented by World Bank staff estimates.
Categories, topics:
Economy & Growth, Financial Sector
Last updated:
apr 23, 2017
Indicators value changes by year
Maximum:
499.604
jan 1, 2016
At the date of observation
Value
Absolute change
Change from previous value
jan 1, 1961
0.714
+0.714
0.0%
jan 1, 1962
0.714
0.0
0.0%
jan 1, 1963
0.714
0.0
0.0%
jan 1, 1964
0.714
0.0
0.0%
jan 1, 1965
0.714
0.0
0.0%
jan 1, 1966
0.714
0.0
0.0%
jan 1, 1967
0.714
0.0
0.0%
jan 1, 1968
0.724
+0.01
1.39%
jan 1, 1969
0.833
+0.109
15.07%
jan 1, 1970
0.833
0.0
0.0%
jan 1, 1971
0.833
0.0
0.0%
jan 1, 1972
0.831
-0.002
-0.29%
jan 1, 1973
0.802
-0.029
-3.53%
jan 1, 1974
0.819
+0.018
2.21%
jan 1, 1975
0.841
+0.022
2.68%
jan 1, 1976
0.864
+0.023
2.69%
jan 1, 1977
0.913
+0.049
5.69%
jan 1, 1978
0.903
-0.01
-1.1%
jan 1, 1979
0.844
-0.059
-6.55%
jan 1, 1980
0.817
-0.027
-3.18%
jan 1, 1981
0.812
-0.005
-0.59%
jan 1, 1982
0.895
+0.083
10.25%
jan 1, 1983
1.056
+0.16
17.89%
jan 1, 1984
1.175
+0.119
11.3%
jan 1, 1985
1.413
+0.239
20.31%
jan 1, 1986
1.719
+0.306
21.63%
jan 1, 1987
1.861
+0.142
8.26%
jan 1, 1988
2.209
+0.348
18.68%
jan 1, 1989
2.561
+0.353
15.96%
jan 1, 1990
2.76
+0.198
7.74%
jan 1, 1991
2.729
-0.031
-1.11%
jan 1, 1992
2.803
+0.074
2.73%
jan 1, 1993
3.603
+0.8
28.54%
jan 1, 1994
4.403
+0.8
22.19%
jan 1, 1995
8.736
+4.334
98.43%
jan 1, 1996
15.284
+6.547
74.94%
jan 1, 1997
15.308
+0.025
0.16%
jan 1, 1998
16.444
+1.136
7.42%
jan 1, 1999
31.073
+14.629
88.96%
jan 1, 2000
44.088
+13.015
41.89%
jan 1, 2001
59.544
+15.456
35.06%
jan 1, 2002
72.197
+12.654
21.25%
jan 1, 2003
76.687
+4.489
6.22%
jan 1, 2004
97.432
+20.746
27.05%
jan 1, 2005
108.898
+11.465
11.77%
jan 1, 2006
118.42
+9.522
8.74%
jan 1, 2007
136.013
+17.594
14.86%
jan 1, 2008
140.003
+3.99
2.93%
jan 1, 2009
140.52
+0.517
0.37%
jan 1, 2010
141.071
+0.551
0.39%
jan 1, 2011
150.534
+9.464
6.71%
jan 1, 2012
156.916
+6.382
4.24%
jan 1, 2013
251.101
+94.185
60.02%
jan 1, 2014
370.224
+119.123
47.44%
jan 1, 2015
424.374
+54.15
14.63%
jan 1, 2016
499.604
+75.23
17.73%
Ranking of countries by current statistics by years


Comments: