29
/
en
AIzaSyAYiBZKx7MnpbEhh9jyipgxe19OcubqV5w
April 1, 2024
130298
Ethiopia
ETH
true
2
1
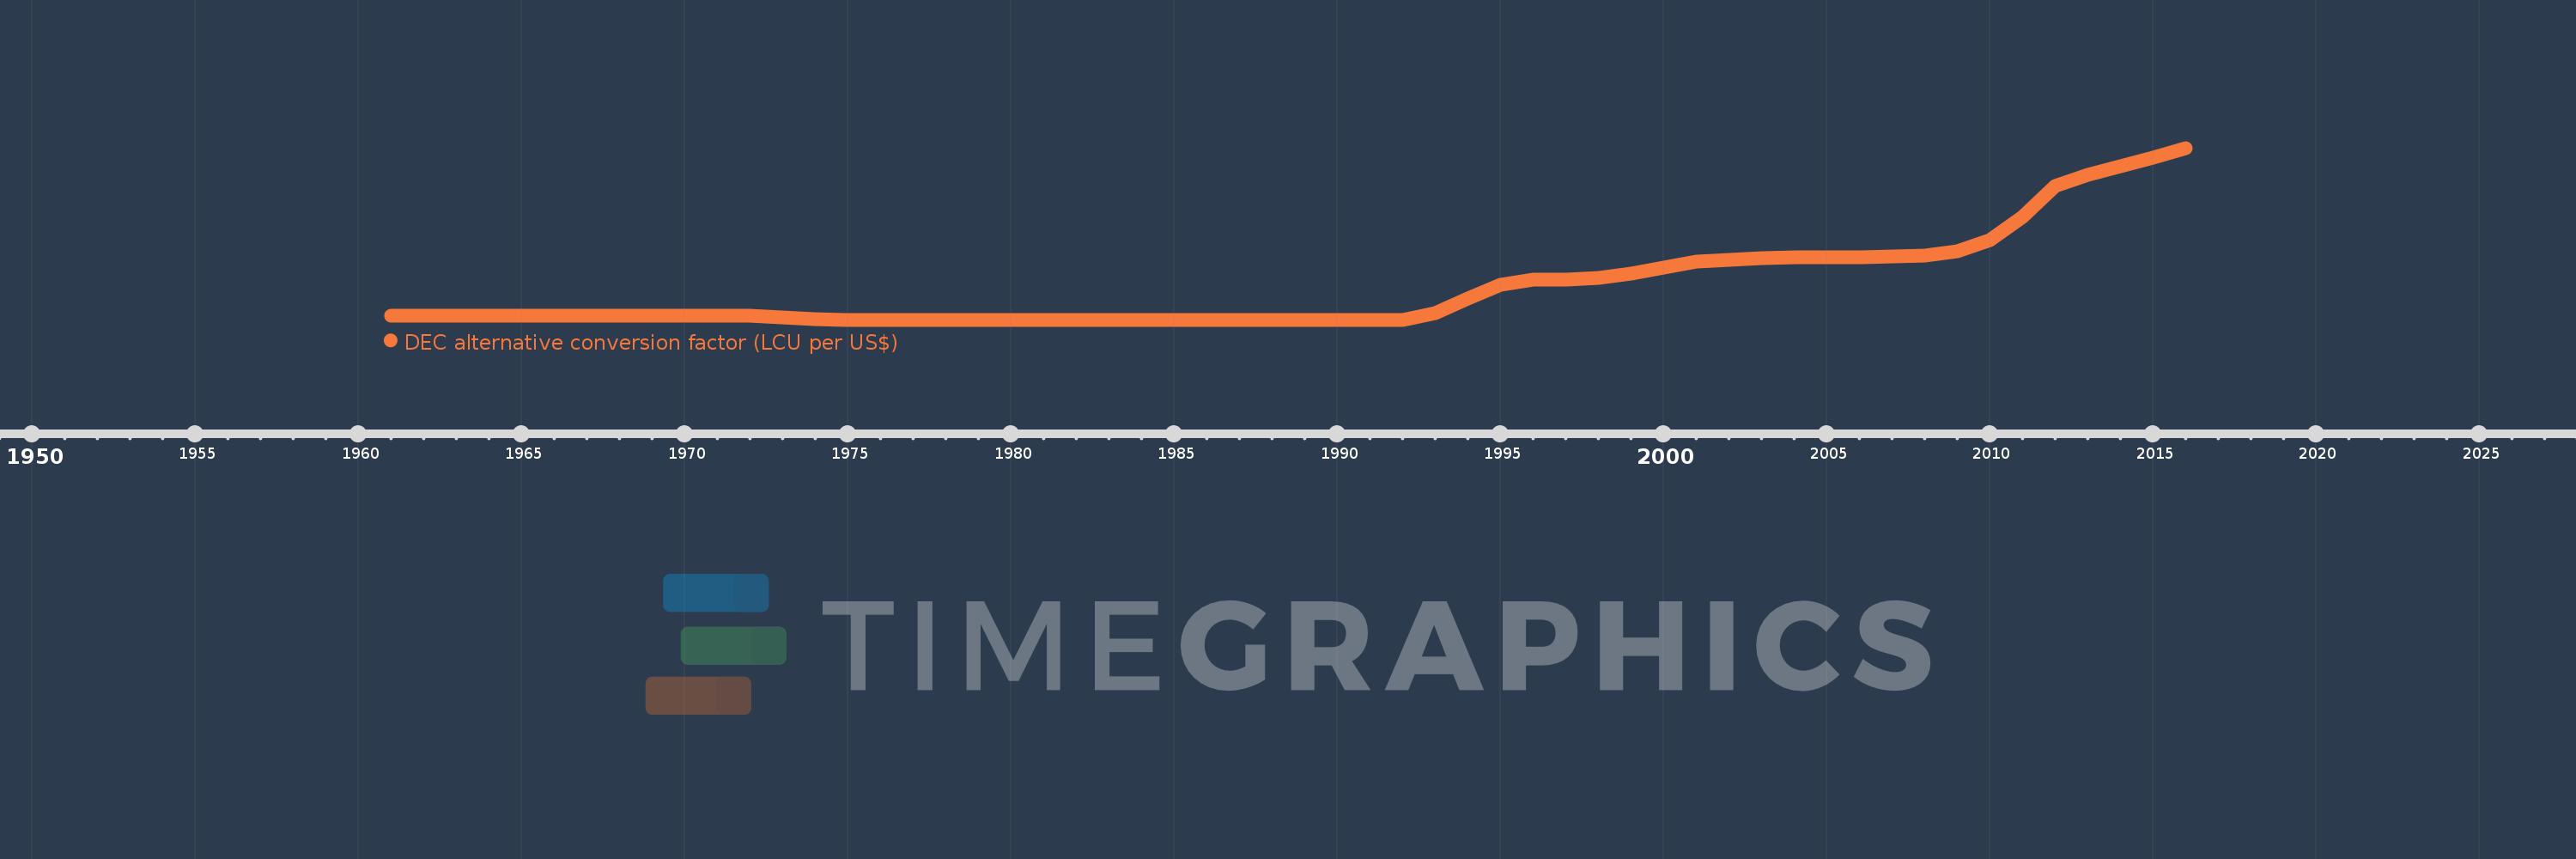
DEC alternative conversion factor (LCU per US$)
2016,2015,2014,2013,2012,2011,2010,2009,2008,2007,2006,2005,2004,2003,2002,2001,2000,1999,1998,1997,1996,1995,1994,1993,1992,1991,1990,1989,1988,1987,1986,1985,1984,1983,1982,1981,1980,1979,1978,1977,1976,1975,1974,1973,1972,1971,1970,1969,1968,1967,1966,1965,1964,1963,1962,1961
This statistics in other country:
AfghanistanAlbaniaAlgeriaAmerican SamoaAndorraAngolaAntigua and BarbudaArgentinaArmeniaArubaAustraliaAustriaAzerbaijanBahamas, TheBahrainBangladeshBarbadosBelarusBelgiumBelizeBeninBermudaBhutanBoliviaBosnia and HerzegovinaBotswanaBrazilBrunei DarussalamBulgariaBurkina FasoBurundiCabo VerdeCambodiaCameroonCanadaCayman IslandsCentral African RepublicChadChannel IslandsChileChinaColombiaComorosCongo, Dem. Rep.Congo, Rep.Costa RicaCote d'IvoireCroatiaCubaCyprusCzech RepublicDenmarkDjiboutiDominicaDominican RepublicEcuadorEgypt, Arab Rep.El SalvadorEquatorial GuineaEritreaEstoniaEthiopiaFaroe IslandsFijiFinlandFranceFrench PolynesiaGabonGambia, TheGeorgiaGermanyGhanaGreeceGreenlandGrenadaGuatemalaGuineaGuinea-BissauGuyanaHaitiHondurasHong Kong SAR, ChinaHungaryIcelandIndiaIndonesiaIran, Islamic Rep.IraqIrelandIsle of ManIsraelItalyJamaicaJapanJordanKazakhstanKenyaKiribatiKorea, Rep.KosovoKuwaitKyrgyz RepublicLao PDRLatviaLebanonLesothoLiberiaLibyaLiechtensteinLithuaniaLuxembourgMacao SAR, ChinaMacedonia, FYRMadagascarMalawiMalaysiaMaldivesMaliMaltaMarshall IslandsMauritaniaMauritiusMexicoMicronesia, Fed. Sts.MoldovaMonacoMongoliaMontenegroMoroccoMozambiqueMyanmarNamibiaNauruNepalNetherlandsNew CaledoniaNew ZealandNicaraguaNigerNigeriaNorwayOmanPakistanPalauPanamaPapua New GuineaParaguayPeruPhilippinesPolandPortugalPuerto RicoQatarRomaniaRussian FederationRwandaSamoaSan MarinoSao Tome and PrincipeSaudi ArabiaSenegalSerbiaSeychellesSierra LeoneSingaporeSlovak RepublicSloveniaSolomon IslandsSomaliaSouth AfricaSouth SudanSpainSri LankaSt. Kitts and NevisSt. LuciaSt. Vincent and the GrenadinesSudanSurinameSwazilandSwedenSwitzerlandSyrian Arab RepublicTajikistanTanzaniaThailandTimor-LesteTogoTongaTrinidad and TobagoTunisiaTurkeyTurkmenistanTuvaluUgandaUkraineUnited Arab EmiratesUnited KingdomUnited StatesUruguayUzbekistanVanuatuVenezuela, RBVietnamVirgin Islands (U.S.)West Bank and GazaYemen, Rep.ZambiaZimbabwe Timeline:
This timeline shows a graph from 1961 to 2016 of Ethiopia. No data until 1960. Number of actual observations by date: 56.
Source name:
World Development Indicators
Source organization:
International Monetary Fund, International Financial Statistics, supplemented by World Bank staff estimates.
Categories, topics:
Economy & Growth, Financial Sector
Last updated:
apr 23, 2017
Indicators value changes by year
Maximum:
20.096
jan 1, 2016
At the date of observation
Value
Absolute change
Change from previous value
jan 1, 1961
2.485
+2.485
0.0%
jan 1, 1962
2.485
0.0
0.0%
jan 1, 1963
2.485
0.0
0.0%
jan 1, 1964
2.485
0.0
0.0%
jan 1, 1965
2.5
+0.015
0.62%
jan 1, 1972
2.494
-0.006
-0.26%
jan 1, 1973
2.3
-0.194
-7.76%
jan 1, 1974
2.099
-0.201
-8.75%
jan 1, 1975
2.07
-0.029
-1.37%
jan 1, 1993
2.803
+0.733
35.39%
jan 1, 1994
4.272
+1.469
52.42%
jan 1, 1995
5.783
+1.512
35.39%
jan 1, 1996
6.253
+0.47
8.13%
jan 1, 1997
6.318
+0.065
1.04%
jan 1, 1998
6.498
+0.18
2.85%
jan 1, 1999
6.882
+0.384
5.9%
jan 1, 2000
7.511
+0.629
9.14%
jan 1, 2001
8.148
+0.637
8.48%
jan 1, 2002
8.328
+0.18
2.21%
jan 1, 2003
8.543
+0.215
2.58%
jan 1, 2004
8.581
+0.038
0.44%
jan 1, 2005
8.62
+0.039
0.45%
jan 1, 2006
8.652
+0.032
0.37%
jan 1, 2007
8.681
+0.029
0.34%
jan 1, 2008
8.794
+0.113
1.3%
jan 1, 2009
9.244
+0.45
5.12%
jan 1, 2010
10.419
+1.175
12.71%
jan 1, 2011
12.891
+2.472
23.73%
jan 1, 2012
16.12
+3.229
25.05%
jan 1, 2013
17.255
+1.135
7.04%
jan 1, 2014
18.194
+0.939
5.44%
jan 1, 2015
19.075
+0.881
4.84%
jan 1, 2016
20.096
+1.02
5.35%
Ranking of countries by current statistics by years


Comments: