29
/
en
AIzaSyAYiBZKx7MnpbEhh9jyipgxe19OcubqV5w
April 1, 2024
208655
New Caledonia
NCL
true
2
1
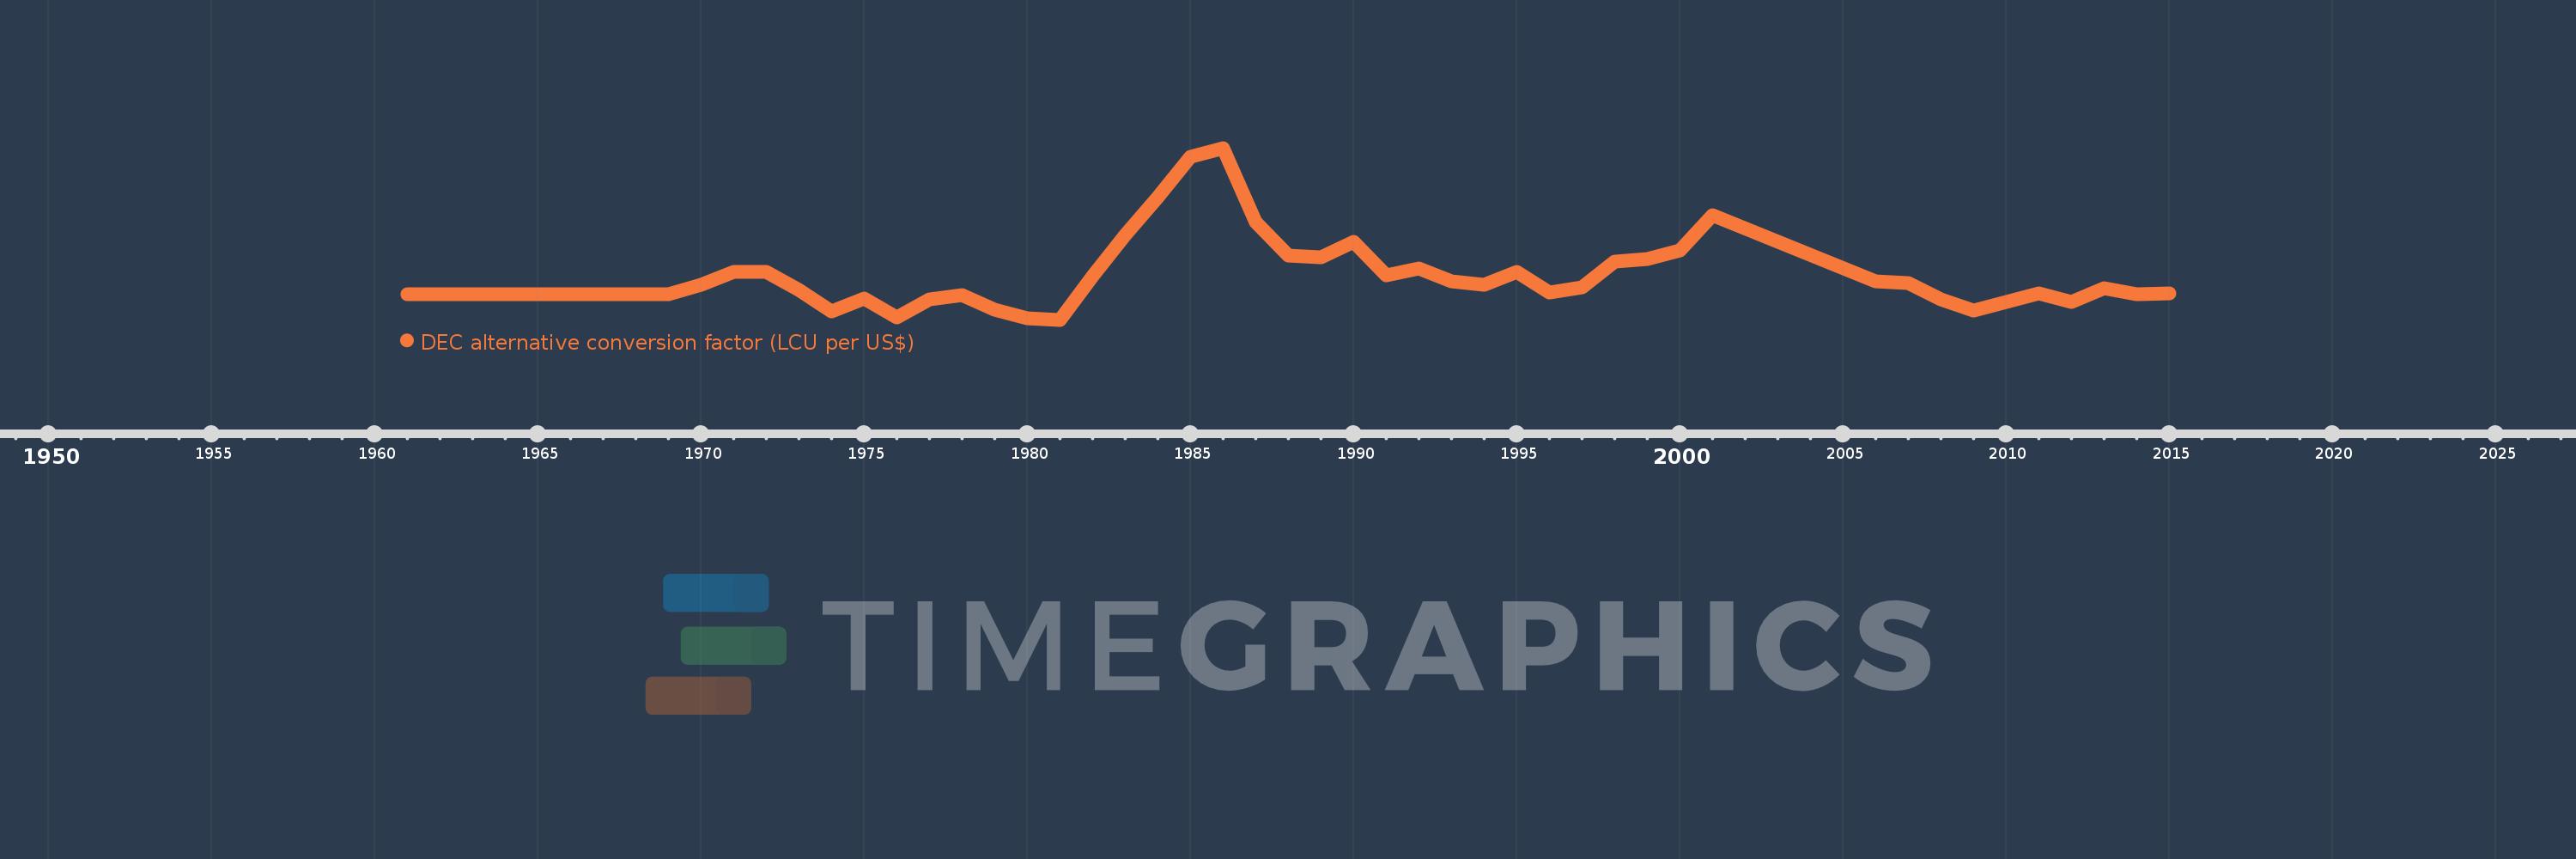
DEC alternative conversion factor (LCU per US$)
2015,2014,2013,2012,2011,2010,2009,2008,2007,2006,2001,2000,1999,1998,1997,1996,1995,1994,1993,1992,1991,1990,1989,1988,1987,1986,1985,1984,1983,1982,1981,1980,1979,1978,1977,1976,1975,1974,1973,1972,1971,1970,1969,1968,1967,1966,1965,1964,1963,1962,1961
This statistics in other country:
AfghanistanAlbaniaAlgeriaAmerican SamoaAndorraAngolaAntigua and BarbudaArgentinaArmeniaArubaAustraliaAustriaAzerbaijanBahamas, TheBahrainBangladeshBarbadosBelarusBelgiumBelizeBeninBermudaBhutanBoliviaBosnia and HerzegovinaBotswanaBrazilBrunei DarussalamBulgariaBurkina FasoBurundiCabo VerdeCambodiaCameroonCanadaCayman IslandsCentral African RepublicChadChannel IslandsChileChinaColombiaComorosCongo, Dem. Rep.Congo, Rep.Costa RicaCote d'IvoireCroatiaCubaCyprusCzech RepublicDenmarkDjiboutiDominicaDominican RepublicEcuadorEgypt, Arab Rep.El SalvadorEquatorial GuineaEritreaEstoniaEthiopiaFaroe IslandsFijiFinlandFranceFrench PolynesiaGabonGambia, TheGeorgiaGermanyGhanaGreeceGreenlandGrenadaGuatemalaGuineaGuinea-BissauGuyanaHaitiHondurasHong Kong SAR, ChinaHungaryIcelandIndiaIndonesiaIran, Islamic Rep.IraqIrelandIsle of ManIsraelItalyJamaicaJapanJordanKazakhstanKenyaKiribatiKorea, Rep.KosovoKuwaitKyrgyz RepublicLao PDRLatviaLebanonLesothoLiberiaLibyaLiechtensteinLithuaniaLuxembourgMacao SAR, ChinaMacedonia, FYRMadagascarMalawiMalaysiaMaldivesMaliMaltaMarshall IslandsMauritaniaMauritiusMexicoMicronesia, Fed. Sts.MoldovaMonacoMongoliaMontenegroMoroccoMozambiqueMyanmarNamibiaNauruNepalNetherlandsNew CaledoniaNew ZealandNicaraguaNigerNigeriaNorwayOmanPakistanPalauPanamaPapua New GuineaParaguayPeruPhilippinesPolandPortugalPuerto RicoQatarRomaniaRussian FederationRwandaSamoaSan MarinoSao Tome and PrincipeSaudi ArabiaSenegalSerbiaSeychellesSierra LeoneSingaporeSlovak RepublicSloveniaSolomon IslandsSomaliaSouth AfricaSouth SudanSpainSri LankaSt. Kitts and NevisSt. LuciaSt. Vincent and the GrenadinesSudanSurinameSwazilandSwedenSwitzerlandSyrian Arab RepublicTajikistanTanzaniaThailandTimor-LesteTogoTongaTrinidad and TobagoTunisiaTurkeyTurkmenistanTuvaluUgandaUkraineUnited Arab EmiratesUnited KingdomUnited StatesUruguayUzbekistanVanuatuVenezuela, RBVietnamVirgin Islands (U.S.)West Bank and GazaYemen, Rep.ZambiaZimbabwe Timeline:
This timeline shows a graph from 1961 to 2015 of New Caledonia. No data until 1960. Number of actual observations by date: 51.
Source name:
World Development Indicators
Source organization:
International Monetary Fund, International Financial Statistics, supplemented by World Bank staff estimates.
Categories, topics:
Economy & Growth, Financial Sector
Last updated:
apr 23, 2017
Indicators value changes by year
Minimum:
76.829
jan 1, 1981
Maximum:
163.367
jan 1, 1986
At the date of observation
Value
Absolute change
Change from previous value
jan 1, 1961
89.765
+89.765
0.0%
jan 1, 1962
89.765
0.0
0.0%
jan 1, 1963
89.765
0.0
0.0%
jan 1, 1964
89.765
0.0
0.0%
jan 1, 1965
89.765
0.0
0.0%
jan 1, 1966
89.765
0.0
0.0%
jan 1, 1967
89.765
0.0
0.0%
jan 1, 1968
89.765
0.0
0.0%
jan 1, 1969
89.765
0.0
0.0%
jan 1, 1970
94.44
+4.675
5.21%
jan 1, 1971
100.985
+6.545
6.93%
jan 1, 1972
100.775
-0.21
-0.21%
jan 1, 1973
91.812
-8.963
-8.89%
jan 1, 1974
81.05
-10.762
-11.72%
jan 1, 1975
87.529
+6.479
7.99%
jan 1, 1976
77.932
-9.597
-10.96%
jan 1, 1977
86.891
+8.959
11.5%
jan 1, 1978
89.338
+2.447
2.82%
jan 1, 1979
82.056
-7.282
-8.15%
jan 1, 1980
77.353
-4.703
-5.73%
jan 1, 1981
76.829
-0.524
-0.68%
jan 1, 1982
98.811
+21.982
28.61%
jan 1, 1983
119.49
+20.679
20.93%
jan 1, 1984
138.573
+19.083
15.97%
jan 1, 1985
158.902
+20.329
14.67%
jan 1, 1986
163.367
+4.465
2.81%
jan 1, 1987
125.935
-37.432
-22.91%
jan 1, 1988
109.284
-16.651
-13.22%
jan 1, 1989
108.31
-0.974
-0.89%
jan 1, 1990
116.003
+7.693
7.1%
jan 1, 1991
99.01
-16.993
-14.65%
jan 1, 1992
102.584
+3.574
3.61%
jan 1, 1993
96.255
-6.329
-6.17%
jan 1, 1994
94.653
-1.602
-1.66%
jan 1, 1995
100.946
+6.293
6.65%
jan 1, 1996
90.754
-10.192
-10.1%
jan 1, 1997
93.009
+2.255
2.49%
jan 1, 1998
106.11
+13.101
14.09%
jan 1, 1999
107.25
+1.14
1.07%
jan 1, 2000
111.93
+4.68
4.36%
jan 1, 2001
129.44
+17.51
15.64%
jan 1, 2006
95.957
-33.483
-25.87%
jan 1, 2007
95.124
-0.833
-0.87%
jan 1, 2008
87.188
-7.936
-8.34%
jan 1, 2009
81.465
-5.723
-6.56%
jan 1, 2010
85.9
+4.435
5.44%
jan 1, 2011
90.101
+4.201
4.89%
jan 1, 2012
85.842
-4.259
-4.73%
jan 1, 2013
92.875
+7.033
8.19%
jan 1, 2014
89.876
-2.999
-3.23%
jan 1, 2015
89.944
+0.068
0.08%
Ranking of countries by current statistics by years


Comments: