29
/
en
AIzaSyAYiBZKx7MnpbEhh9jyipgxe19OcubqV5w
April 1, 2024
268738
Tunisia
TUN
true
2
1
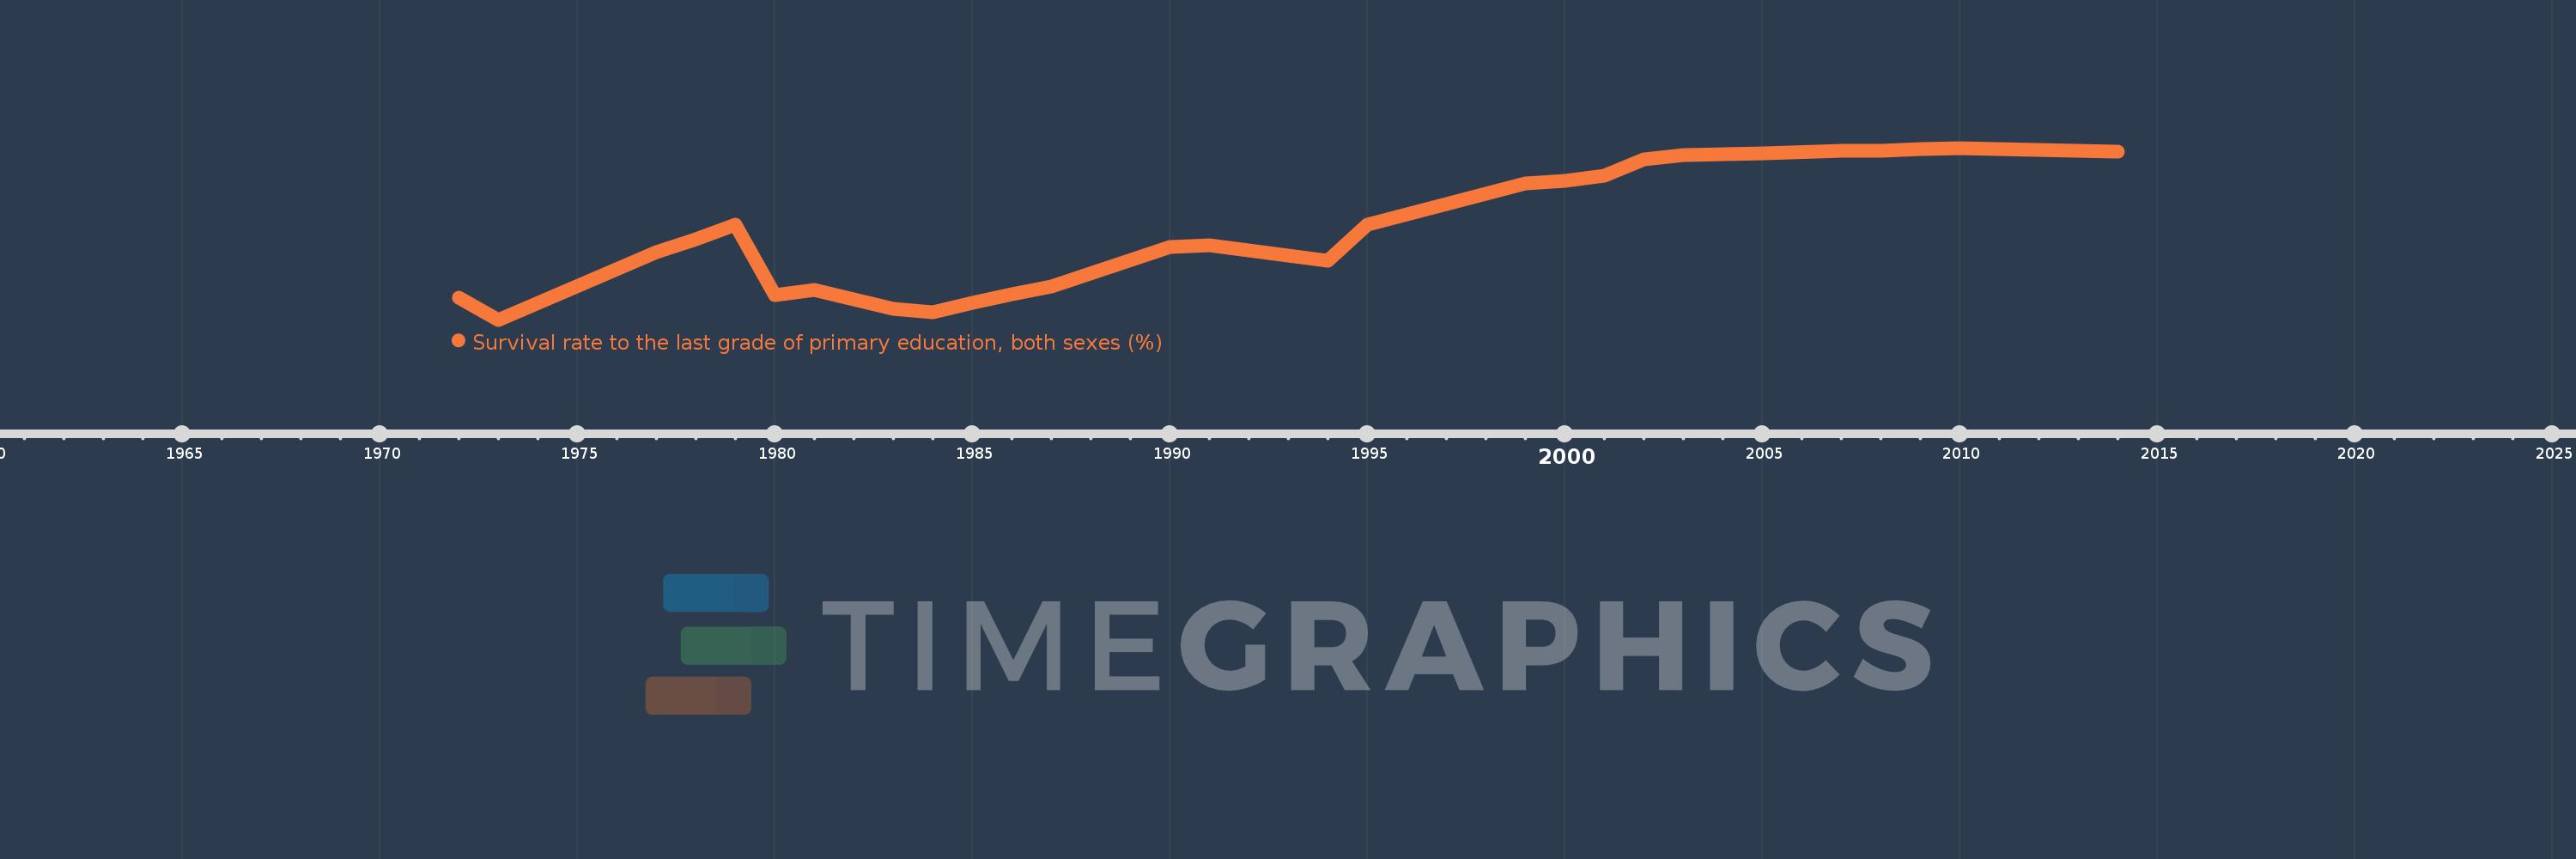
Survival rate to the last grade of primary education, both sexes (%)
2014,2013,2010,2009,2008,2007,2005,2004,2003,2002,2001,2000,1999,1995,1994,1991,1990,1987,1986,1985,1984,1983,1981,1980,1979,1978,1977,1973,1972
This statistics in other country:
AfghanistanAlbaniaAlgeriaAndorraAngolaAntigua and BarbudaArab WorldArgentinaArmeniaArubaAustriaAzerbaijanBahamas, TheBahrainBangladeshBarbadosBelarusBelgiumBelizeBeninBermudaBhutanBoliviaBosnia and HerzegovinaBotswanaBrazilBrunei DarussalamBulgariaBurkina FasoBurundiCabo VerdeCambodiaCameroonCanadaCaribbean small statesCayman IslandsCentral African RepublicCentral Europe and the BalticsChadChileChinaColombiaComorosCongo, Dem. Rep.Congo, Rep.Costa RicaCote d'IvoireCroatiaCubaCyprusCzech RepublicDenmarkDjiboutiDominicaDominican RepublicEarly-demographic dividendEast Asia & PacificEast Asia & Pacific (excluding high income)East Asia & Pacific (IDA & IBRD countries)EcuadorEgypt, Arab Rep.El SalvadorEquatorial GuineaEritreaEstoniaEthiopiaEuro areaEurope & Central AsiaEurope & Central Asia (excluding high income)Europe & Central Asia (IDA & IBRD countries)European UnionFijiFinlandFragile and conflict affected situationsFranceGabonGambia, TheGeorgiaGermanyGhanaGreeceGuatemalaGuineaGuinea-BissauGuyanaHaitiHeavily indebted poor countries (HIPC)High incomeHondurasHong Kong SAR, ChinaHungaryIBRD onlyIcelandIDA & IBRD totalIDA blendIDA onlyIDA totalIndiaIndonesiaIran, Islamic Rep.IraqIsraelItalyJamaicaJapanJordanKazakhstanKenyaKiribatiKorea, Rep.KuwaitKyrgyz RepublicLao PDRLate-demographic dividendLatin America & Caribbean Latin America & Caribbean (excluding high income)Latin America & the Caribbean (IDA & IBRD countries)LatviaLeast developed countries: UN classificationLebanonLesothoLiberiaLibyaLiechtensteinLithuaniaLow & middle incomeLow incomeLower middle incomeLuxembourgMacao SAR, ChinaMacedonia, FYRMadagascarMalawiMalaysiaMaldivesMaliMaltaMarshall IslandsMauritaniaMauritiusMexicoMiddle East & North AfricaMiddle East & North Africa (excluding high income)Middle East & North Africa (IDA & IBRD countries)Middle incomeMoldovaMonacoMongoliaMontenegroMoroccoMozambiqueMyanmarNamibiaNepalNetherlandsNicaraguaNigerNigeriaNorth AmericaNorwayOECD membersOmanOther small statesPacific island small statesPakistanPanamaPapua New GuineaParaguayPeruPhilippinesPolandPortugalPost-demographic dividendPre-demographic dividendQatarRomaniaRussian FederationRwandaSamoaSan MarinoSao Tome and PrincipeSaudi ArabiaSenegalSerbiaSeychellesSierra LeoneSingaporeSlovak RepublicSloveniaSmall statesSolomon IslandsSouth AfricaSouth AsiaSouth Asia (IDA & IBRD)SpainSri LankaSt. Kitts and NevisSt. LuciaSt. Vincent and the GrenadinesSub-Saharan Africa Sub-Saharan Africa (excluding high income)Sub-Saharan Africa (IDA & IBRD countries)SudanSurinameSwazilandSwedenSwitzerlandSyrian Arab RepublicTajikistanTanzaniaThailandTimor-LesteTogoTongaTrinidad and TobagoTunisiaTurkeyUgandaUkraineUnited Arab EmiratesUpper middle incomeUruguayUzbekistanVanuatuVenezuela, RBVietnamWest Bank and GazaWorldYemen, Rep.ZambiaZimbabwe Timeline:
This timeline shows a graph from 1972 to 2014 of Tunisia. No data until 1971. Number of actual observations by date: 29.
Source name:
World Development Indicators
Source organization:
UNESCO Institute for Statistics
Categories, topics:
Education
Last updated:
apr 23, 2017
Indicators value changes by year
Minimum:
54.252
jan 1, 1973
Maximum:
94.849
jan 1, 2010
At the date of observation
Value
Absolute change
Change from previous value
jan 1, 1972
59.455
+59.455
0.0%
jan 1, 1973
54.252
-5.203
-8.75%
jan 1, 1977
70.149
+15.896
29.3%
jan 1, 1978
73.268
+3.12
4.45%
jan 1, 1979
76.637
+3.369
4.6%
jan 1, 1980
60.036
-16.601
-21.66%
jan 1, 1981
61.265
+1.229
2.05%
jan 1, 1983
56.743
-4.522
-7.38%
jan 1, 1984
55.984
-0.759
-1.34%
jan 1, 1985
58.156
+2.172
3.88%
jan 1, 1986
60.275
+2.119
3.64%
jan 1, 1987
62.206
+1.931
3.2%
jan 1, 1990
71.522
+9.316
14.98%
jan 1, 1991
71.793
+0.27
0.38%
jan 1, 1994
68.206
-3.587
-5.0%
jan 1, 1995
76.638
+8.432
12.36%
jan 1, 1999
86.513
+9.875
12.89%
jan 1, 2000
87.176
+0.664
0.77%
jan 1, 2001
88.34
+1.163
1.33%
jan 1, 2002
92.099
+3.76
4.26%
jan 1, 2003
93.159
+1.059
1.15%
jan 1, 2004
93.286
+0.127
0.14%
jan 1, 2005
93.509
+0.223
0.24%
jan 1, 2007
94.275
+0.767
0.82%
jan 1, 2008
94.131
-0.144
-0.15%
jan 1, 2009
94.684
+0.553
0.59%
jan 1, 2010
94.849
+0.165
0.17%
jan 1, 2013
94.131
-0.717
-0.76%
jan 1, 2014
93.971
-0.16
-0.17%
Ranking of countries by current statistics by years


Comments: