29
/
en
AIzaSyAYiBZKx7MnpbEhh9jyipgxe19OcubqV5w
April 1, 2024
84805
Benin
BEN
true
2
1
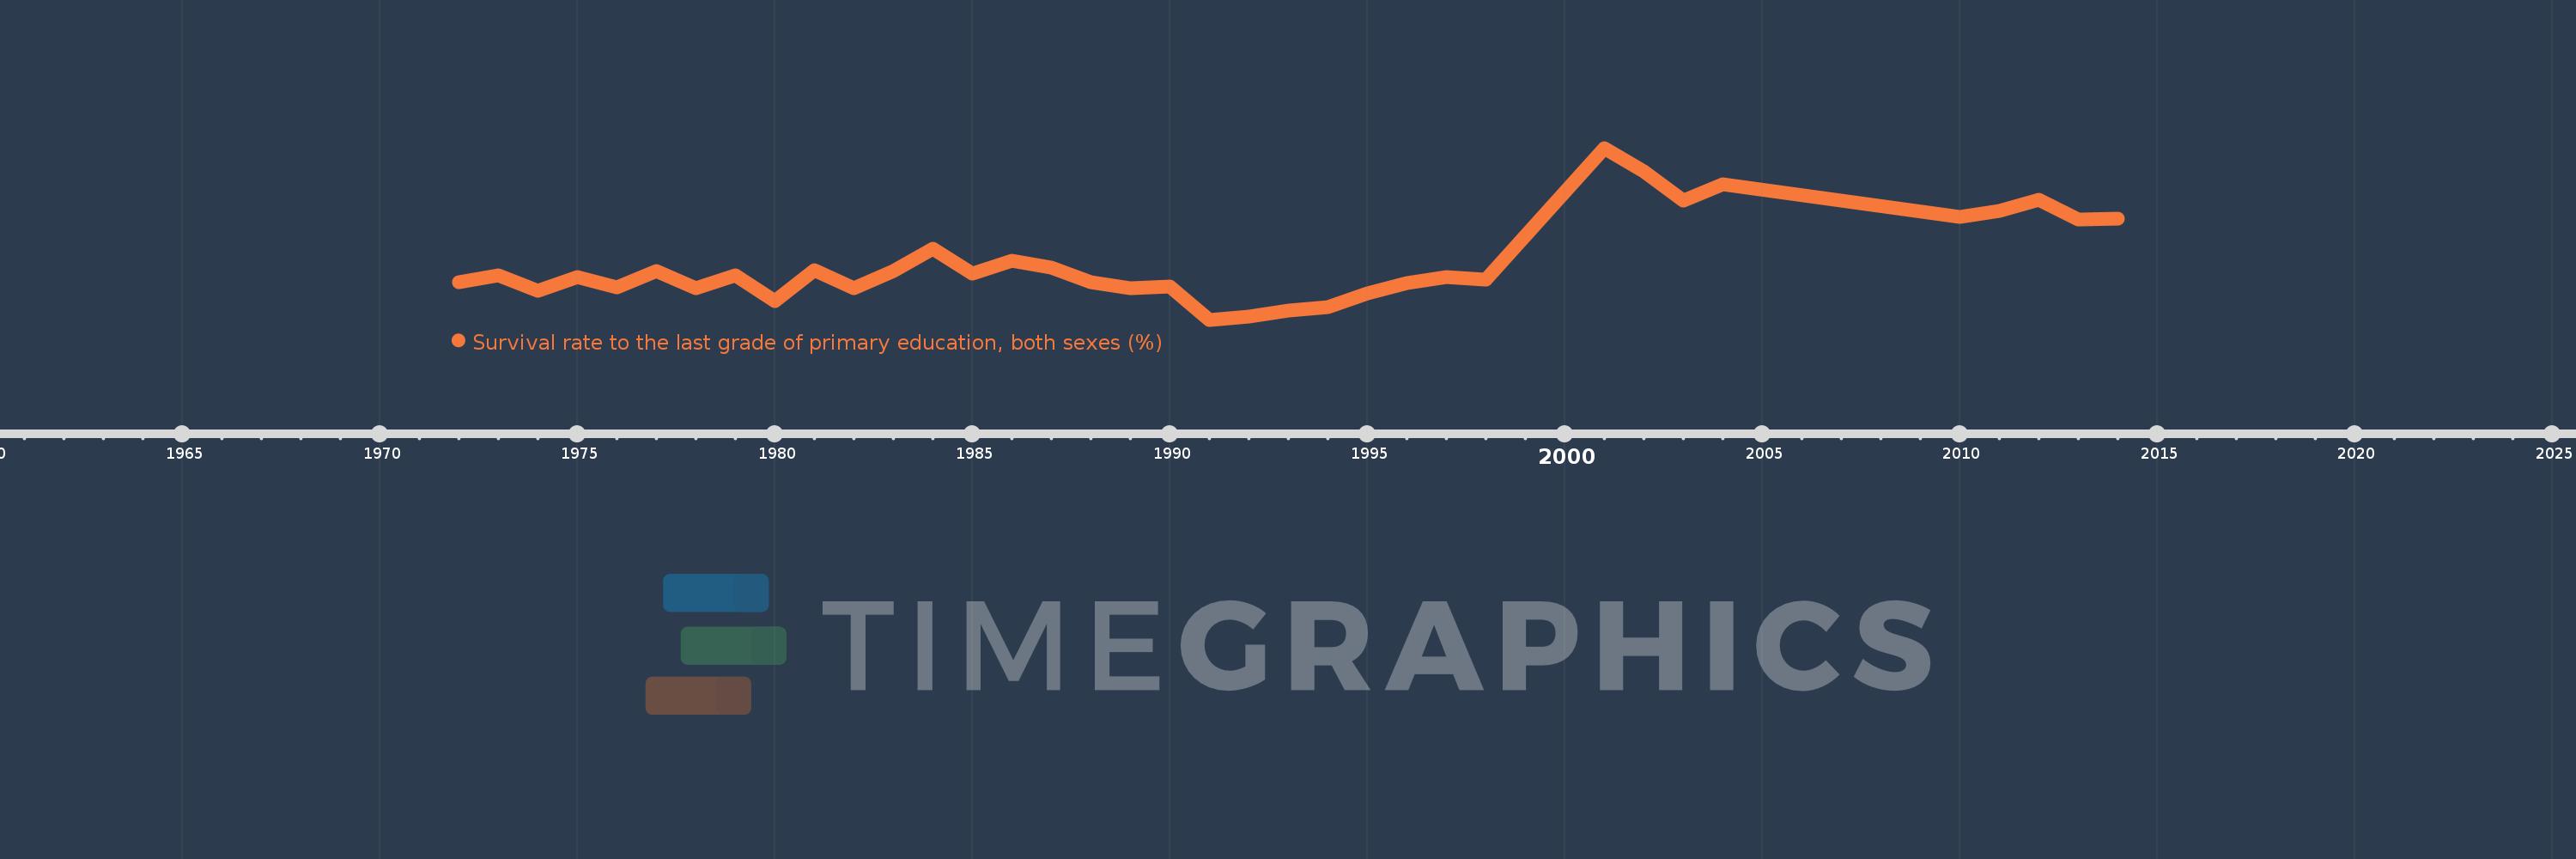
Survival rate to the last grade of primary education, both sexes (%)
2014,2013,2012,2011,2010,2004,2003,2002,2001,1998,1997,1996,1995,1994,1993,1992,1991,1990,1989,1988,1987,1986,1985,1984,1983,1982,1981,1980,1979,1978,1977,1976,1975,1974,1973,1972
This statistics in other country:
AfghanistanAlbaniaAlgeriaAndorraAngolaAntigua and BarbudaArab WorldArgentinaArmeniaArubaAustriaAzerbaijanBahamas, TheBahrainBangladeshBarbadosBelarusBelgiumBelizeBeninBermudaBhutanBoliviaBosnia and HerzegovinaBotswanaBrazilBrunei DarussalamBulgariaBurkina FasoBurundiCabo VerdeCambodiaCameroonCanadaCaribbean small statesCayman IslandsCentral African RepublicCentral Europe and the BalticsChadChileChinaColombiaComorosCongo, Dem. Rep.Congo, Rep.Costa RicaCote d'IvoireCroatiaCubaCyprusCzech RepublicDenmarkDjiboutiDominicaDominican RepublicEarly-demographic dividendEast Asia & PacificEast Asia & Pacific (excluding high income)East Asia & Pacific (IDA & IBRD countries)EcuadorEgypt, Arab Rep.El SalvadorEquatorial GuineaEritreaEstoniaEthiopiaEuro areaEurope & Central AsiaEurope & Central Asia (excluding high income)Europe & Central Asia (IDA & IBRD countries)European UnionFijiFinlandFragile and conflict affected situationsFranceGabonGambia, TheGeorgiaGermanyGhanaGreeceGuatemalaGuineaGuinea-BissauGuyanaHaitiHeavily indebted poor countries (HIPC)High incomeHondurasHong Kong SAR, ChinaHungaryIBRD onlyIcelandIDA & IBRD totalIDA blendIDA onlyIDA totalIndiaIndonesiaIran, Islamic Rep.IraqIsraelItalyJamaicaJapanJordanKazakhstanKenyaKiribatiKorea, Rep.KuwaitKyrgyz RepublicLao PDRLate-demographic dividendLatin America & Caribbean Latin America & Caribbean (excluding high income)Latin America & the Caribbean (IDA & IBRD countries)LatviaLeast developed countries: UN classificationLebanonLesothoLiberiaLibyaLiechtensteinLithuaniaLow & middle incomeLow incomeLower middle incomeLuxembourgMacao SAR, ChinaMacedonia, FYRMadagascarMalawiMalaysiaMaldivesMaliMaltaMarshall IslandsMauritaniaMauritiusMexicoMiddle East & North AfricaMiddle East & North Africa (excluding high income)Middle East & North Africa (IDA & IBRD countries)Middle incomeMoldovaMonacoMongoliaMontenegroMoroccoMozambiqueMyanmarNamibiaNepalNetherlandsNicaraguaNigerNigeriaNorth AmericaNorwayOECD membersOmanOther small statesPacific island small statesPakistanPanamaPapua New GuineaParaguayPeruPhilippinesPolandPortugalPost-demographic dividendPre-demographic dividendQatarRomaniaRussian FederationRwandaSamoaSan MarinoSao Tome and PrincipeSaudi ArabiaSenegalSerbiaSeychellesSierra LeoneSingaporeSlovak RepublicSloveniaSmall statesSolomon IslandsSouth AfricaSouth AsiaSouth Asia (IDA & IBRD)SpainSri LankaSt. Kitts and NevisSt. LuciaSt. Vincent and the GrenadinesSub-Saharan Africa Sub-Saharan Africa (excluding high income)Sub-Saharan Africa (IDA & IBRD countries)SudanSurinameSwazilandSwedenSwitzerlandSyrian Arab RepublicTajikistanTanzaniaThailandTimor-LesteTogoTongaTrinidad and TobagoTunisiaTurkeyUgandaUkraineUnited Arab EmiratesUpper middle incomeUruguayUzbekistanVanuatuVenezuela, RBVietnamWest Bank and GazaWorldYemen, Rep.ZambiaZimbabwe Timeline:
This timeline shows a graph from 1972 to 2014 of Benin. No data until 1971. Number of actual observations by date: 36.
Source name:
World Development Indicators
Source organization:
UNESCO Institute for Statistics
Categories, topics:
Education
Last updated:
apr 23, 2017
Indicators value changes by year
Minimum:
21.465
jan 1, 1991
Maximum:
75.739
jan 1, 2001
At the date of observation
Value
Absolute change
Change from previous value
jan 1, 1972
33.425
+33.425
0.0%
jan 1, 1973
35.43
+2.006
6.0%
jan 1, 1974
30.523
-4.907
-13.85%
jan 1, 1975
34.912
+4.389
14.38%
jan 1, 1976
31.731
-3.181
-9.11%
jan 1, 1977
36.902
+5.171
16.3%
jan 1, 1978
31.365
-5.538
-15.01%
jan 1, 1979
35.564
+4.199
13.39%
jan 1, 1980
27.302
-8.262
-23.23%
jan 1, 1981
36.994
+9.692
35.5%
jan 1, 1982
31.491
-5.503
-14.88%
jan 1, 1983
36.853
+5.362
17.03%
jan 1, 1984
43.774
+6.921
18.78%
jan 1, 1985
35.946
-7.828
-17.88%
jan 1, 1986
40.219
+4.273
11.89%
jan 1, 1987
38.058
-2.161
-5.37%
jan 1, 1988
33.219
-4.839
-12.72%
jan 1, 1989
31.531
-1.688
-5.08%
jan 1, 1990
31.974
+0.443
1.41%
jan 1, 1991
21.465
-10.509
-32.87%
jan 1, 1992
22.432
+0.967
4.51%
jan 1, 1993
24.473
+2.041
9.1%
jan 1, 1994
25.343
+0.87
3.55%
jan 1, 1995
29.889
+4.546
17.94%
jan 1, 1996
33.106
+3.217
10.76%
jan 1, 1997
34.932
+1.827
5.52%
jan 1, 1998
34.009
-0.923
-2.64%
jan 1, 2001
75.739
+41.73
122.7%
jan 1, 2002
68.215
-7.524
-9.93%
jan 1, 2003
59.106
-9.109
-13.35%
jan 1, 2004
64.27
+5.164
8.74%
jan 1, 2010
53.937
-10.333
-16.08%
jan 1, 2011
55.784
+1.848
3.43%
jan 1, 2012
59.261
+3.477
6.23%
jan 1, 2013
53.235
-6.026
-10.17%
jan 1, 2014
53.387
+0.152
0.29%
Ranking of countries by current statistics by years


Comments: