29
/
en
AIzaSyAYiBZKx7MnpbEhh9jyipgxe19OcubqV5w
April 1, 2024
255851
Swaziland
SWZ
true
2
1
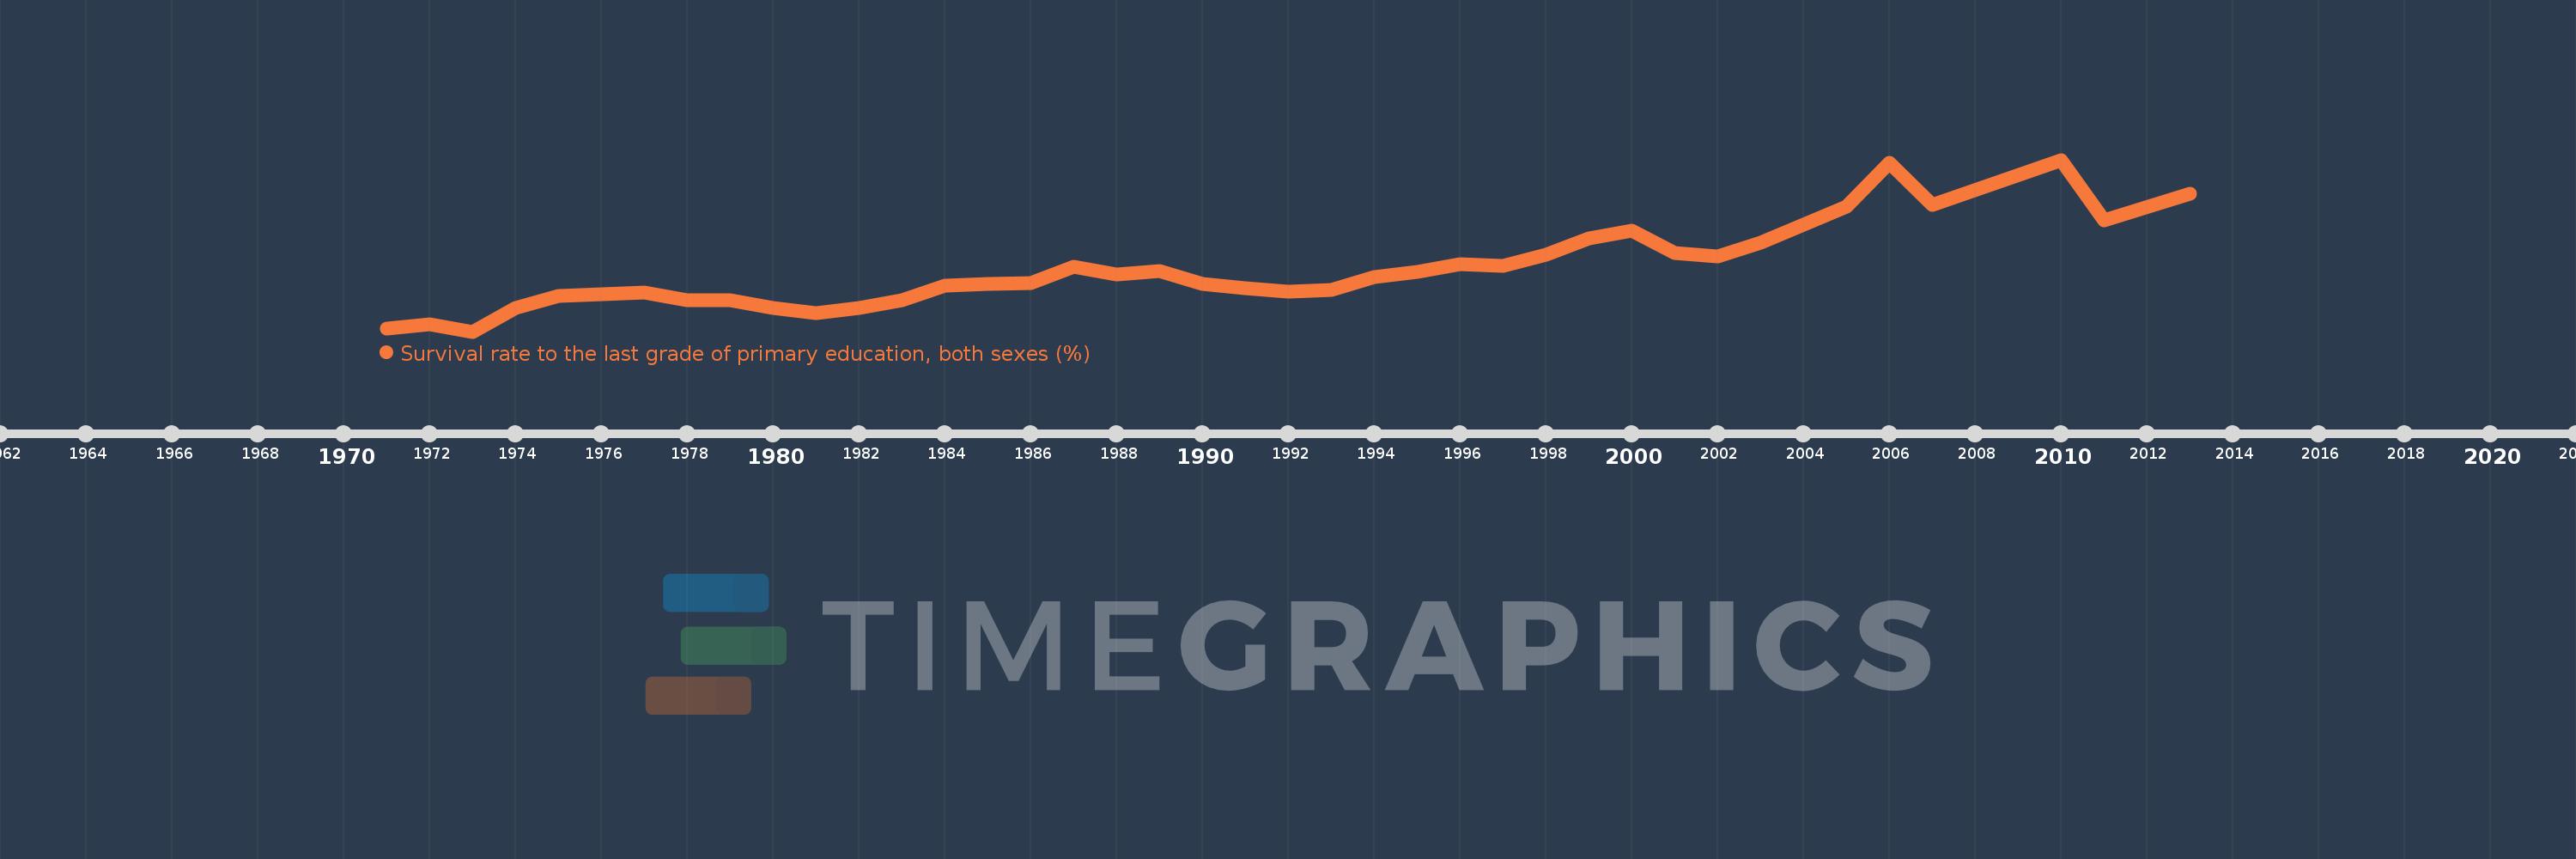
Survival rate to the last grade of primary education, both sexes (%)
2013,2011,2010,2007,2006,2005,2003,2002,2001,2000,1999,1998,1997,1996,1995,1994,1993,1992,1991,1990,1989,1988,1987,1986,1985,1984,1983,1982,1981,1980,1979,1978,1977,1976,1975,1974,1973,1972,1971
This statistics in other country:
AfghanistanAlbaniaAlgeriaAndorraAngolaAntigua and BarbudaArab WorldArgentinaArmeniaArubaAustriaAzerbaijanBahamas, TheBahrainBangladeshBarbadosBelarusBelgiumBelizeBeninBermudaBhutanBoliviaBosnia and HerzegovinaBotswanaBrazilBrunei DarussalamBulgariaBurkina FasoBurundiCabo VerdeCambodiaCameroonCanadaCaribbean small statesCayman IslandsCentral African RepublicCentral Europe and the BalticsChadChileChinaColombiaComorosCongo, Dem. Rep.Congo, Rep.Costa RicaCote d'IvoireCroatiaCubaCyprusCzech RepublicDenmarkDjiboutiDominicaDominican RepublicEarly-demographic dividendEast Asia & PacificEast Asia & Pacific (excluding high income)East Asia & Pacific (IDA & IBRD countries)EcuadorEgypt, Arab Rep.El SalvadorEquatorial GuineaEritreaEstoniaEthiopiaEuro areaEurope & Central AsiaEurope & Central Asia (excluding high income)Europe & Central Asia (IDA & IBRD countries)European UnionFijiFinlandFragile and conflict affected situationsFranceGabonGambia, TheGeorgiaGermanyGhanaGreeceGuatemalaGuineaGuinea-BissauGuyanaHaitiHeavily indebted poor countries (HIPC)High incomeHondurasHong Kong SAR, ChinaHungaryIBRD onlyIcelandIDA & IBRD totalIDA blendIDA onlyIDA totalIndiaIndonesiaIran, Islamic Rep.IraqIsraelItalyJamaicaJapanJordanKazakhstanKenyaKiribatiKorea, Rep.KuwaitKyrgyz RepublicLao PDRLate-demographic dividendLatin America & Caribbean Latin America & Caribbean (excluding high income)Latin America & the Caribbean (IDA & IBRD countries)LatviaLeast developed countries: UN classificationLebanonLesothoLiberiaLibyaLiechtensteinLithuaniaLow & middle incomeLow incomeLower middle incomeLuxembourgMacao SAR, ChinaMacedonia, FYRMadagascarMalawiMalaysiaMaldivesMaliMaltaMarshall IslandsMauritaniaMauritiusMexicoMiddle East & North AfricaMiddle East & North Africa (excluding high income)Middle East & North Africa (IDA & IBRD countries)Middle incomeMoldovaMonacoMongoliaMontenegroMoroccoMozambiqueMyanmarNamibiaNepalNetherlandsNicaraguaNigerNigeriaNorth AmericaNorwayOECD membersOmanOther small statesPacific island small statesPakistanPanamaPapua New GuineaParaguayPeruPhilippinesPolandPortugalPost-demographic dividendPre-demographic dividendQatarRomaniaRussian FederationRwandaSamoaSan MarinoSao Tome and PrincipeSaudi ArabiaSenegalSerbiaSeychellesSierra LeoneSingaporeSlovak RepublicSloveniaSmall statesSolomon IslandsSouth AfricaSouth AsiaSouth Asia (IDA & IBRD)SpainSri LankaSt. Kitts and NevisSt. LuciaSt. Vincent and the GrenadinesSub-Saharan Africa Sub-Saharan Africa (excluding high income)Sub-Saharan Africa (IDA & IBRD countries)SudanSurinameSwazilandSwedenSwitzerlandSyrian Arab RepublicTajikistanTanzaniaThailandTimor-LesteTogoTongaTrinidad and TobagoTunisiaTurkeyUgandaUkraineUnited Arab EmiratesUpper middle incomeUruguayUzbekistanVanuatuVenezuela, RBVietnamWest Bank and GazaWorldYemen, Rep.ZambiaZimbabwe Timeline:
This timeline shows a graph from 1971 to 2013 of Swaziland. No data until 1970. Number of actual observations by date: 39.
Source name:
World Development Indicators
Source organization:
UNESCO Institute for Statistics
Categories, topics:
Education
Last updated:
apr 23, 2017
Indicators value changes by year
Minimum:
36.968
jan 1, 1973
Maximum:
83.911
jan 1, 2010
At the date of observation
Value
Absolute change
Change from previous value
jan 1, 1971
37.78
+37.78
0.0%
jan 1, 1972
38.885
+1.105
2.93%
jan 1, 1973
36.968
-1.917
-4.93%
jan 1, 1974
43.454
+6.486
17.54%
jan 1, 1975
46.703
+3.249
7.48%
jan 1, 1976
47.088
+0.385
0.82%
jan 1, 1977
47.702
+0.614
1.3%
jan 1, 1978
45.494
-2.208
-4.63%
jan 1, 1979
45.476
-0.018
-0.04%
jan 1, 1980
43.308
-2.168
-4.77%
jan 1, 1981
41.951
-1.357
-3.13%
jan 1, 1982
43.442
+1.491
3.56%
jan 1, 1983
45.584
+2.142
4.93%
jan 1, 1984
49.499
+3.915
8.59%
jan 1, 1985
49.932
+0.433
0.88%
jan 1, 1986
50.238
+0.306
0.61%
jan 1, 1987
54.582
+4.343
8.65%
jan 1, 1988
52.513
-2.068
-3.79%
jan 1, 1989
53.554
+1.041
1.98%
jan 1, 1990
49.898
-3.656
-6.83%
jan 1, 1991
48.83
-1.068
-2.14%
jan 1, 1992
47.912
-0.918
-1.88%
jan 1, 1993
48.302
+0.391
0.82%
jan 1, 1994
51.859
+3.557
7.36%
jan 1, 1995
53.342
+1.483
2.86%
jan 1, 1996
55.29
+1.948
3.65%
jan 1, 1997
54.923
-0.366
-0.66%
jan 1, 1998
58.034
+3.111
5.66%
jan 1, 1999
62.472
+4.438
7.65%
jan 1, 2000
64.651
+2.18
3.49%
jan 1, 2001
58.544
-6.108
-9.45%
jan 1, 2002
57.469
-1.074
-1.84%
jan 1, 2003
61.273
+3.804
6.62%
jan 1, 2005
71.183
+9.91
16.17%
jan 1, 2006
83.019
+11.837
16.63%
jan 1, 2007
71.702
-11.318
-13.63%
jan 1, 2010
83.911
+12.209
17.03%
jan 1, 2011
67.309
-16.602
-19.78%
jan 1, 2013
74.705
+7.396
10.99%
Ranking of countries by current statistics by years


Comments: