29
/
en
AIzaSyAYiBZKx7MnpbEhh9jyipgxe19OcubqV5w
April 1, 2024
50486
Middle East & North Africa (IDA & IBRD countries)
TMN
false
2
1
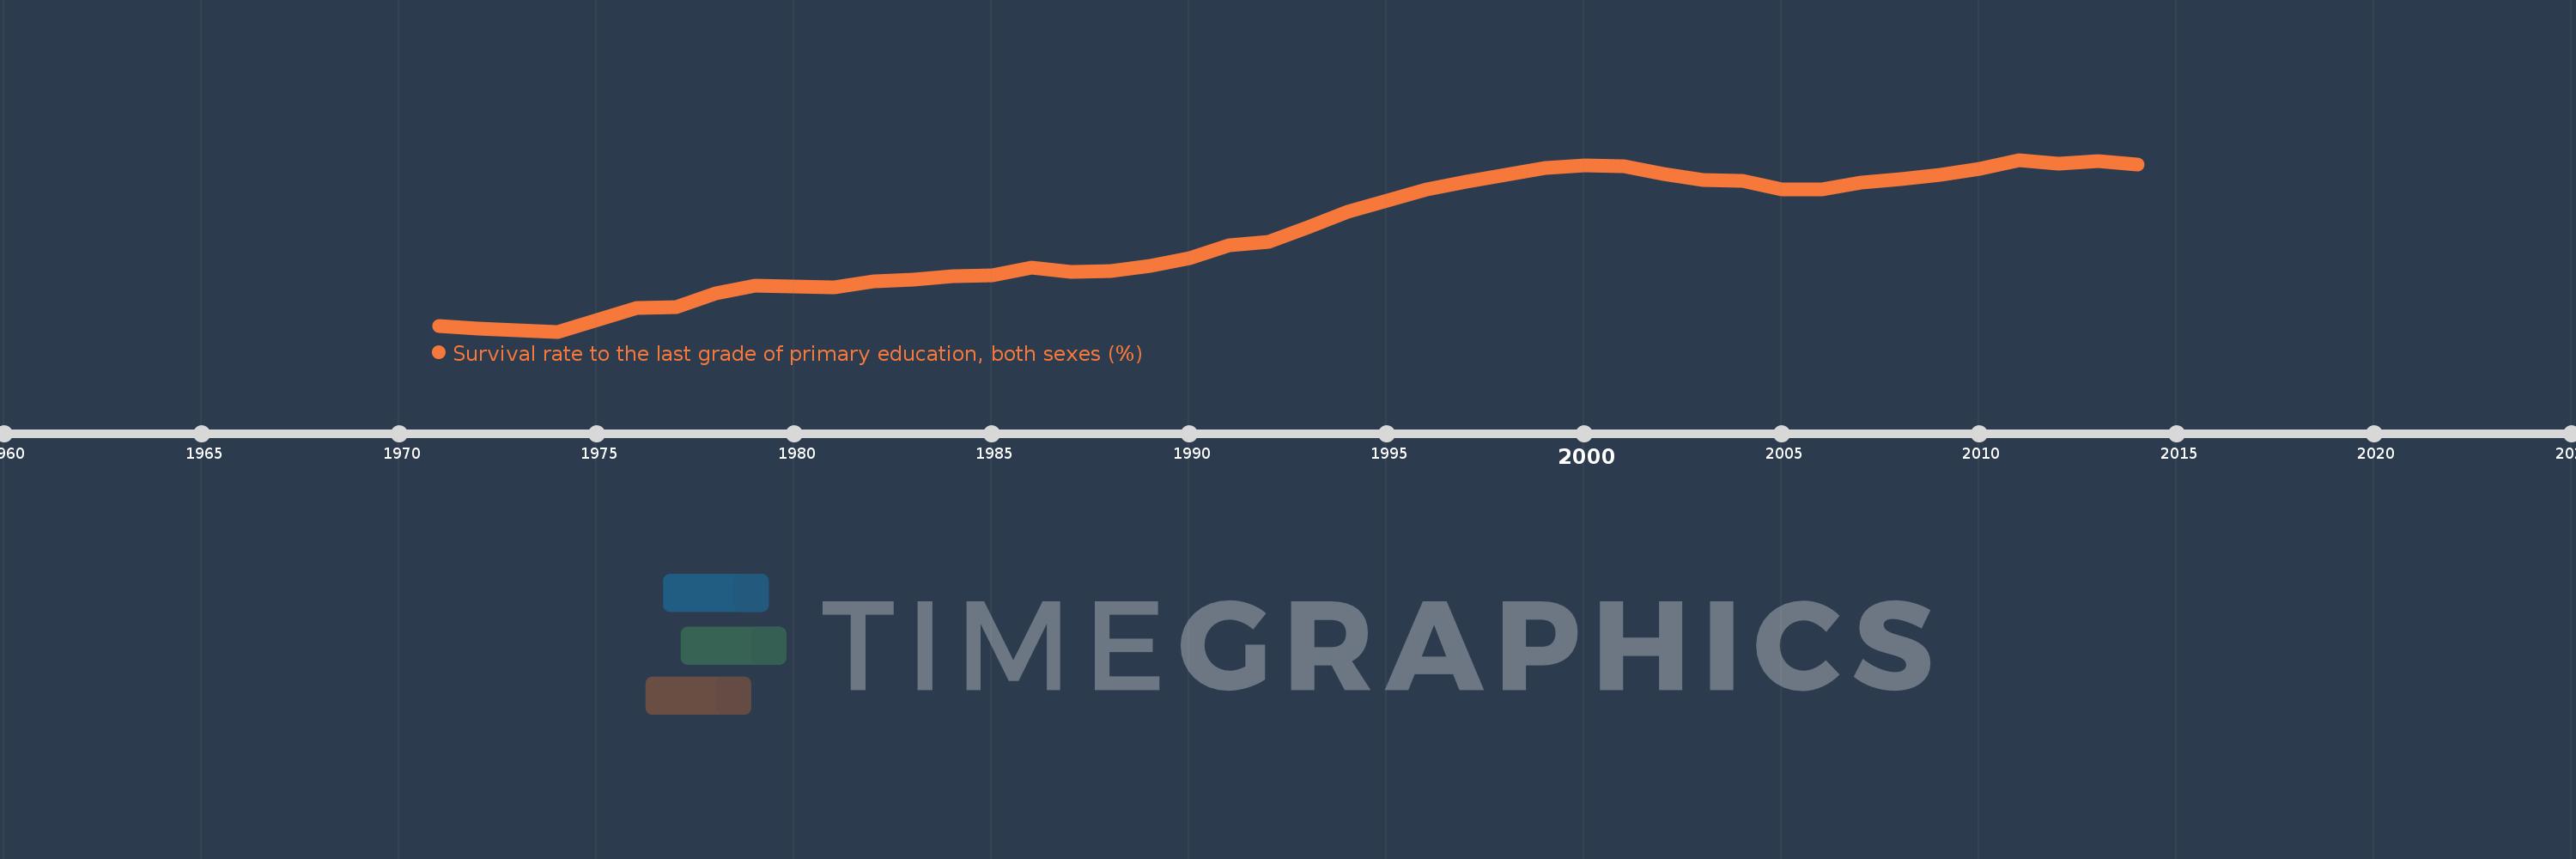
Survival rate to the last grade of primary education, both sexes (%)
2014,2013,2012,2011,2010,2009,2008,2007,2006,2005,2004,2003,2002,2001,2000,1999,1998,1997,1996,1995,1994,1993,1992,1991,1990,1989,1988,1987,1986,1985,1984,1983,1982,1981,1980,1979,1978,1977,1976,1975,1974,1973,1972,1971
This statistics in other country:
AfghanistanAlbaniaAlgeriaAndorraAngolaAntigua and BarbudaArab WorldArgentinaArmeniaArubaAustriaAzerbaijanBahamas, TheBahrainBangladeshBarbadosBelarusBelgiumBelizeBeninBermudaBhutanBoliviaBosnia and HerzegovinaBotswanaBrazilBrunei DarussalamBulgariaBurkina FasoBurundiCabo VerdeCambodiaCameroonCanadaCaribbean small statesCayman IslandsCentral African RepublicCentral Europe and the BalticsChadChileChinaColombiaComorosCongo, Dem. Rep.Congo, Rep.Costa RicaCote d'IvoireCroatiaCubaCyprusCzech RepublicDenmarkDjiboutiDominicaDominican RepublicEarly-demographic dividendEast Asia & PacificEast Asia & Pacific (excluding high income)East Asia & Pacific (IDA & IBRD countries)EcuadorEgypt, Arab Rep.El SalvadorEquatorial GuineaEritreaEstoniaEthiopiaEuro areaEurope & Central AsiaEurope & Central Asia (excluding high income)Europe & Central Asia (IDA & IBRD countries)European UnionFijiFinlandFragile and conflict affected situationsFranceGabonGambia, TheGeorgiaGermanyGhanaGreeceGuatemalaGuineaGuinea-BissauGuyanaHaitiHeavily indebted poor countries (HIPC)High incomeHondurasHong Kong SAR, ChinaHungaryIBRD onlyIcelandIDA & IBRD totalIDA blendIDA onlyIDA totalIndiaIndonesiaIran, Islamic Rep.IraqIsraelItalyJamaicaJapanJordanKazakhstanKenyaKiribatiKorea, Rep.KuwaitKyrgyz RepublicLao PDRLate-demographic dividendLatin America & Caribbean Latin America & Caribbean (excluding high income)Latin America & the Caribbean (IDA & IBRD countries)LatviaLeast developed countries: UN classificationLebanonLesothoLiberiaLibyaLiechtensteinLithuaniaLow & middle incomeLow incomeLower middle incomeLuxembourgMacao SAR, ChinaMacedonia, FYRMadagascarMalawiMalaysiaMaldivesMaliMaltaMarshall IslandsMauritaniaMauritiusMexicoMiddle East & North AfricaMiddle East & North Africa (excluding high income)Middle East & North Africa (IDA & IBRD countries)Middle incomeMoldovaMonacoMongoliaMontenegroMoroccoMozambiqueMyanmarNamibiaNepalNetherlandsNicaraguaNigerNigeriaNorth AmericaNorwayOECD membersOmanOther small statesPacific island small statesPakistanPanamaPapua New GuineaParaguayPeruPhilippinesPolandPortugalPost-demographic dividendPre-demographic dividendQatarRomaniaRussian FederationRwandaSamoaSan MarinoSao Tome and PrincipeSaudi ArabiaSenegalSerbiaSeychellesSierra LeoneSingaporeSlovak RepublicSloveniaSmall statesSolomon IslandsSouth AfricaSouth AsiaSouth Asia (IDA & IBRD)SpainSri LankaSt. Kitts and NevisSt. LuciaSt. Vincent and the GrenadinesSub-Saharan Africa Sub-Saharan Africa (excluding high income)Sub-Saharan Africa (IDA & IBRD countries)SudanSurinameSwazilandSwedenSwitzerlandSyrian Arab RepublicTajikistanTanzaniaThailandTimor-LesteTogoTongaTrinidad and TobagoTunisiaTurkeyUgandaUkraineUnited Arab EmiratesUpper middle incomeUruguayUzbekistanVanuatuVenezuela, RBVietnamWest Bank and GazaWorldYemen, Rep.ZambiaZimbabwe Timeline:
This timeline shows a graph from 1971 to 2014 of Middle East & North Africa (IDA & IBRD countries). No data until 1970. Number of actual observations by date: 44.
Source name:
World Development Indicators
Source organization:
UNESCO Institute for Statistics
Categories, topics:
Education
Last updated:
apr 23, 2017
Indicators value changes by year
Minimum:
55.836
jan 1, 1974
Maximum:
86.703
jan 1, 2011
At the date of observation
Value
Absolute change
Change from previous value
jan 1, 1971
56.881
+56.881
0.0%
jan 1, 1972
56.441
-0.44
-0.77%
jan 1, 1973
56.014
-0.427
-0.76%
jan 1, 1974
55.836
-0.178
-0.32%
jan 1, 1975
57.871
+2.035
3.64%
jan 1, 1976
60.082
+2.211
3.82%
jan 1, 1977
60.239
+0.156
0.26%
jan 1, 1978
62.764
+2.525
4.19%
jan 1, 1979
64.168
+1.405
2.24%
jan 1, 1980
63.887
-0.282
-0.44%
jan 1, 1981
63.709
-0.178
-0.28%
jan 1, 1982
64.888
+1.179
1.85%
jan 1, 1983
65.239
+0.351
0.54%
jan 1, 1984
65.827
+0.588
0.9%
jan 1, 1985
65.993
+0.166
0.25%
jan 1, 1986
67.367
+1.374
2.08%
jan 1, 1987
66.533
-0.835
-1.24%
jan 1, 1988
66.652
+0.12
0.18%
jan 1, 1989
67.578
+0.925
1.39%
jan 1, 1990
69.047
+1.469
2.17%
jan 1, 1991
71.307
+2.26
3.27%
jan 1, 1992
72.038
+0.731
1.03%
jan 1, 1993
74.582
+2.544
3.53%
jan 1, 1994
77.422
+2.84
3.81%
jan 1, 1995
79.383
+1.961
2.53%
jan 1, 1996
81.379
+1.996
2.51%
jan 1, 1997
82.788
+1.409
1.73%
jan 1, 1998
84.047
+1.259
1.52%
jan 1, 1999
85.218
+1.17
1.39%
jan 1, 2000
85.746
+0.528
0.62%
jan 1, 2001
85.607
-0.139
-0.16%
jan 1, 2002
84.153
-1.455
-1.7%
jan 1, 2003
83.028
-1.124
-1.34%
jan 1, 2004
82.912
-0.117
-0.14%
jan 1, 2005
81.408
-1.504
-1.81%
jan 1, 2006
81.376
-0.032
-0.04%
jan 1, 2007
82.656
+1.28
1.57%
jan 1, 2008
83.296
+0.639
0.77%
jan 1, 2009
83.939
+0.643
0.77%
jan 1, 2010
85.102
+1.163
1.39%
jan 1, 2011
86.703
+1.601
1.88%
jan 1, 2012
85.964
-0.739
-0.85%
jan 1, 2013
86.435
+0.471
0.55%
jan 1, 2014
85.867
-0.569
-0.66%
Ranking of countries by current statistics by years


Comments: