30
/
AIzaSyAYiBZKx7MnpbEhh9jyipgxe19OcubqV5w
April 1, 2024
225426
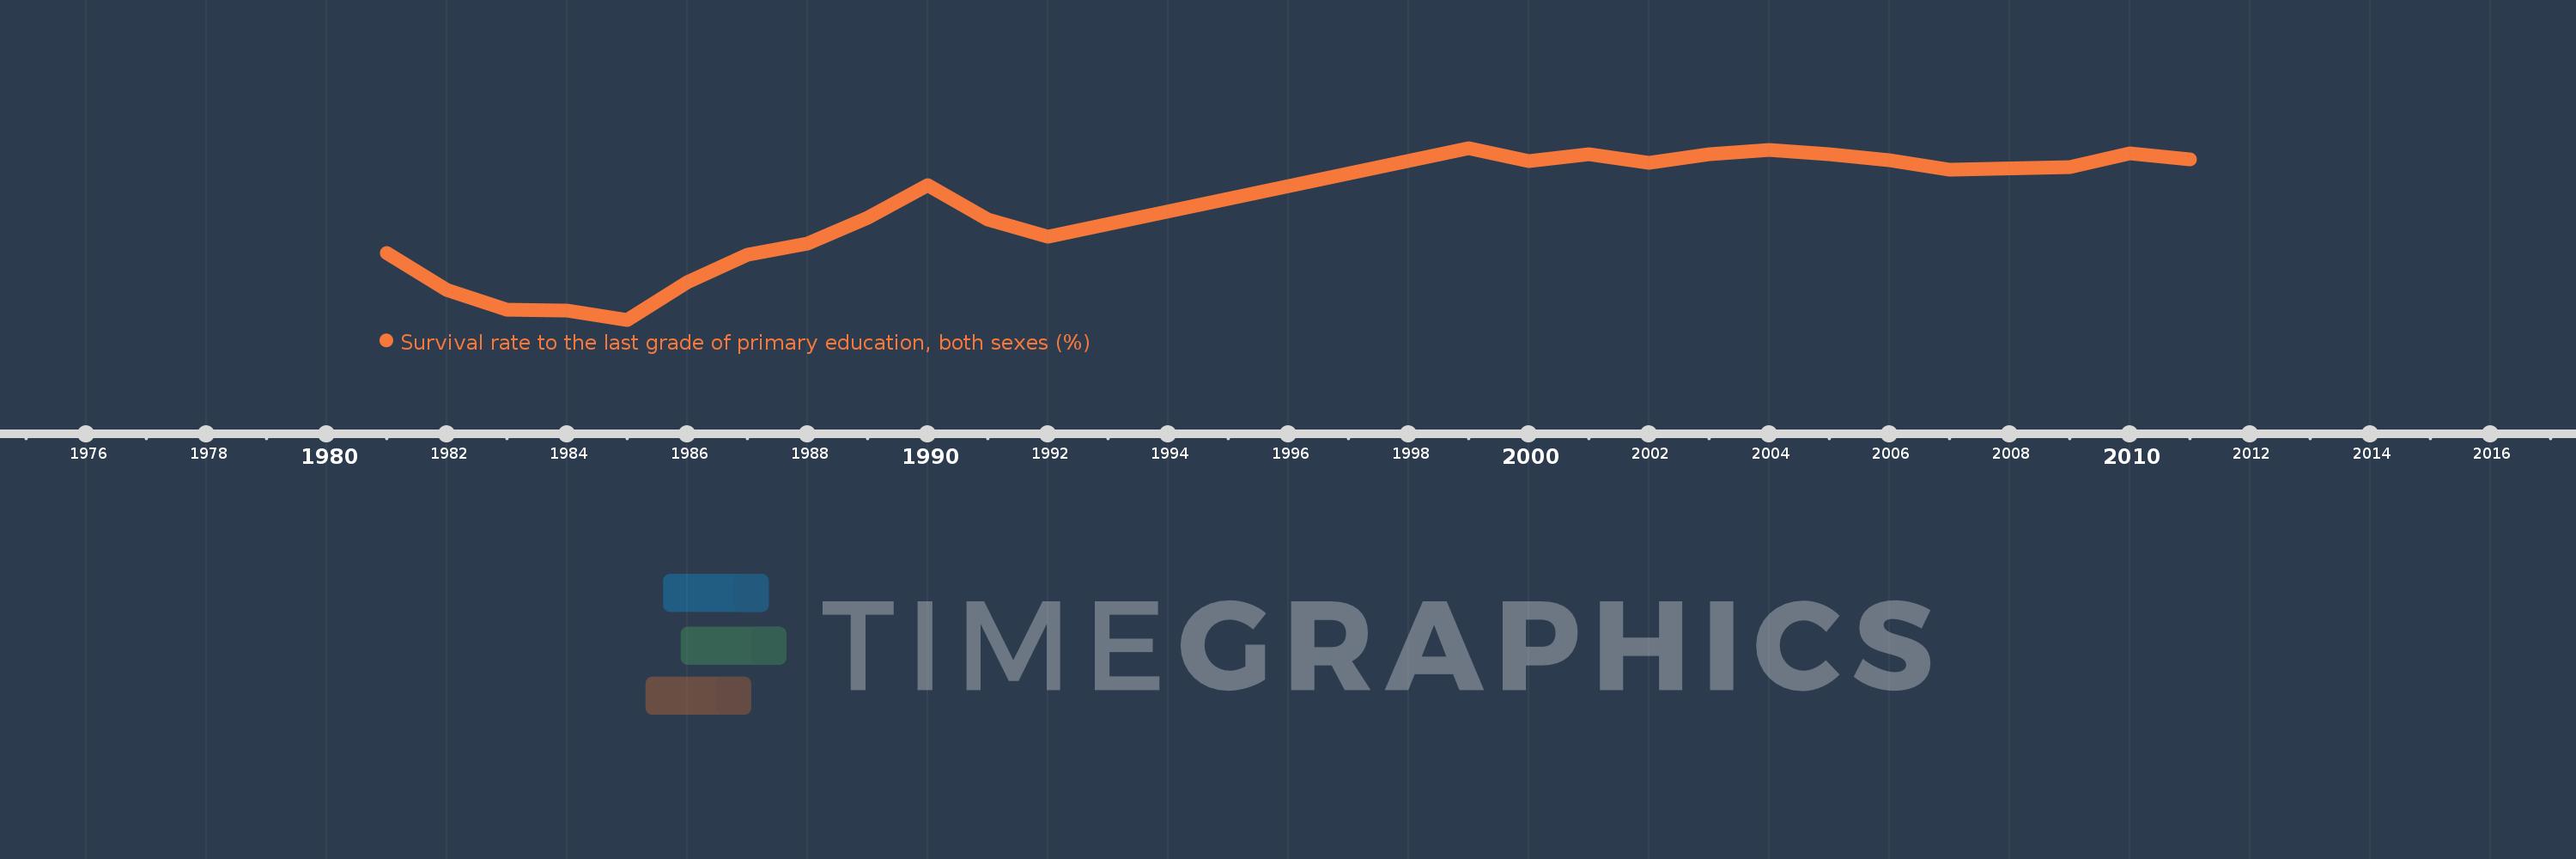
Poland
POL
true
2
1
Survival rate to the last grade of primary education, both sexes (%)
2011,2010,2009,2007,2006,2005,2004,2003,2002,2001,2000,1999,1992,1991,1990,1989,1988,1987,1986,1985,1984,1983,1982,1981
