29
/
en
AIzaSyAYiBZKx7MnpbEhh9jyipgxe19OcubqV5w
April 1, 2024
55188
Post-demographic dividend
PST
false
2
1
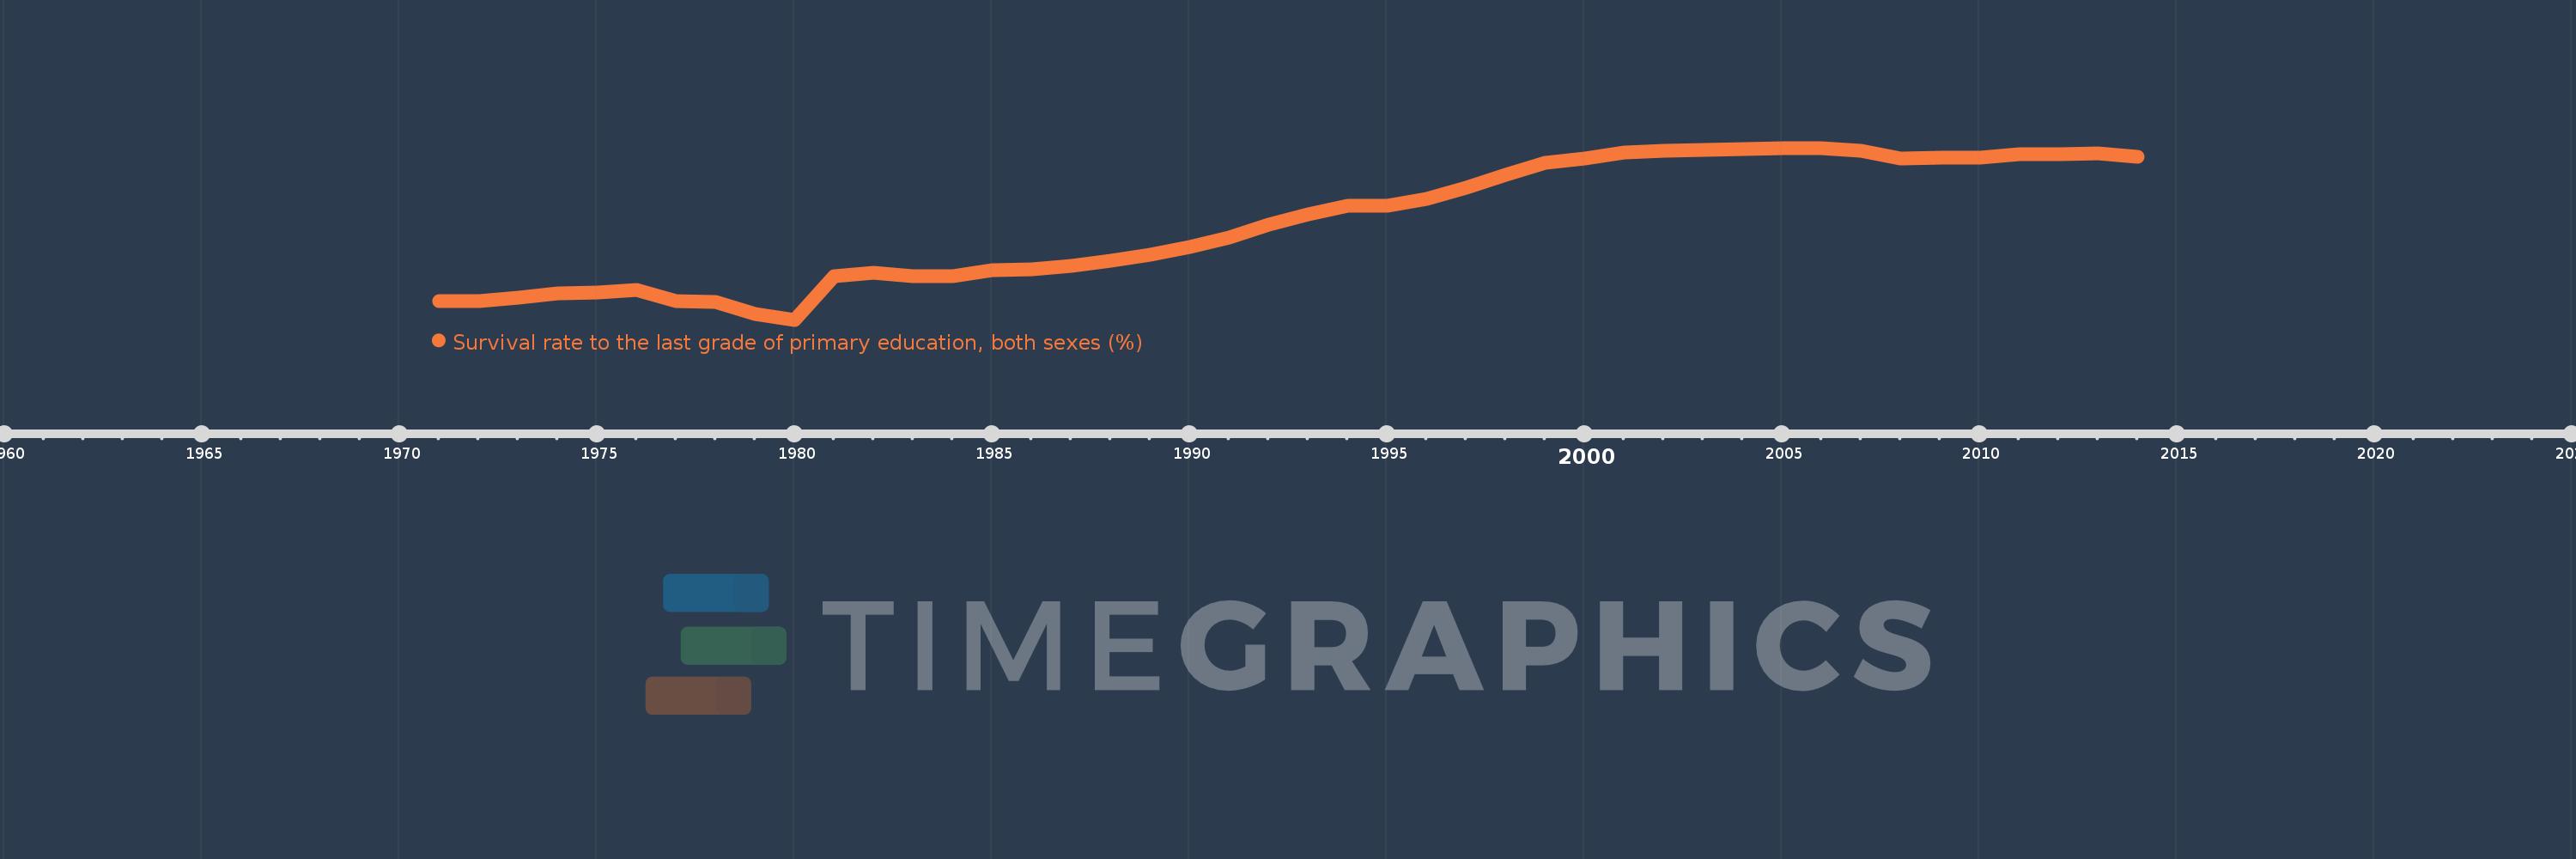
Survival rate to the last grade of primary education, both sexes (%)
2014,2013,2012,2011,2010,2009,2008,2007,2006,2005,2004,2003,2002,2001,2000,1999,1998,1997,1996,1995,1994,1993,1992,1991,1990,1989,1988,1987,1986,1985,1984,1983,1982,1981,1980,1979,1978,1977,1976,1975,1974,1973,1972,1971
This statistics in other country:
AfghanistanAlbaniaAlgeriaAndorraAngolaAntigua and BarbudaArab WorldArgentinaArmeniaArubaAustriaAzerbaijanBahamas, TheBahrainBangladeshBarbadosBelarusBelgiumBelizeBeninBermudaBhutanBoliviaBosnia and HerzegovinaBotswanaBrazilBrunei DarussalamBulgariaBurkina FasoBurundiCabo VerdeCambodiaCameroonCanadaCaribbean small statesCayman IslandsCentral African RepublicCentral Europe and the BalticsChadChileChinaColombiaComorosCongo, Dem. Rep.Congo, Rep.Costa RicaCote d'IvoireCroatiaCubaCyprusCzech RepublicDenmarkDjiboutiDominicaDominican RepublicEarly-demographic dividendEast Asia & PacificEast Asia & Pacific (excluding high income)East Asia & Pacific (IDA & IBRD countries)EcuadorEgypt, Arab Rep.El SalvadorEquatorial GuineaEritreaEstoniaEthiopiaEuro areaEurope & Central AsiaEurope & Central Asia (excluding high income)Europe & Central Asia (IDA & IBRD countries)European UnionFijiFinlandFragile and conflict affected situationsFranceGabonGambia, TheGeorgiaGermanyGhanaGreeceGuatemalaGuineaGuinea-BissauGuyanaHaitiHeavily indebted poor countries (HIPC)High incomeHondurasHong Kong SAR, ChinaHungaryIBRD onlyIcelandIDA & IBRD totalIDA blendIDA onlyIDA totalIndiaIndonesiaIran, Islamic Rep.IraqIsraelItalyJamaicaJapanJordanKazakhstanKenyaKiribatiKorea, Rep.KuwaitKyrgyz RepublicLao PDRLate-demographic dividendLatin America & Caribbean Latin America & Caribbean (excluding high income)Latin America & the Caribbean (IDA & IBRD countries)LatviaLeast developed countries: UN classificationLebanonLesothoLiberiaLibyaLiechtensteinLithuaniaLow & middle incomeLow incomeLower middle incomeLuxembourgMacao SAR, ChinaMacedonia, FYRMadagascarMalawiMalaysiaMaldivesMaliMaltaMarshall IslandsMauritaniaMauritiusMexicoMiddle East & North AfricaMiddle East & North Africa (excluding high income)Middle East & North Africa (IDA & IBRD countries)Middle incomeMoldovaMonacoMongoliaMontenegroMoroccoMozambiqueMyanmarNamibiaNepalNetherlandsNicaraguaNigerNigeriaNorth AmericaNorwayOECD membersOmanOther small statesPacific island small statesPakistanPanamaPapua New GuineaParaguayPeruPhilippinesPolandPortugalPost-demographic dividendPre-demographic dividendQatarRomaniaRussian FederationRwandaSamoaSan MarinoSao Tome and PrincipeSaudi ArabiaSenegalSerbiaSeychellesSierra LeoneSingaporeSlovak RepublicSloveniaSmall statesSolomon IslandsSouth AfricaSouth AsiaSouth Asia (IDA & IBRD)SpainSri LankaSt. Kitts and NevisSt. LuciaSt. Vincent and the GrenadinesSub-Saharan Africa Sub-Saharan Africa (excluding high income)Sub-Saharan Africa (IDA & IBRD countries)SudanSurinameSwazilandSwedenSwitzerlandSyrian Arab RepublicTajikistanTanzaniaThailandTimor-LesteTogoTongaTrinidad and TobagoTunisiaTurkeyUgandaUkraineUnited Arab EmiratesUpper middle incomeUruguayUzbekistanVanuatuVenezuela, RBVietnamWest Bank and GazaWorldYemen, Rep.ZambiaZimbabwe Timeline:
This timeline shows a graph from 1971 to 2014 of Post-demographic dividend. No data until 1970. Number of actual observations by date: 44.
Source name:
World Development Indicators
Source organization:
UNESCO Institute for Statistics
Categories, topics:
Education
Last updated:
apr 23, 2017
Indicators value changes by year
Minimum:
86.335
jan 1, 1980
Maximum:
94.865
jan 1, 2005
At the date of observation
Value
Absolute change
Change from previous value
jan 1, 1971
87.276
+87.276
0.0%
jan 1, 1972
87.248
-0.028
-0.03%
jan 1, 1973
87.421
+0.173
0.2%
jan 1, 1974
87.648
+0.227
0.26%
jan 1, 1975
87.7
+0.052
0.06%
jan 1, 1976
87.812
+0.113
0.13%
jan 1, 1977
87.253
-0.56
-0.64%
jan 1, 1978
87.205
-0.047
-0.05%
jan 1, 1979
86.637
-0.568
-0.65%
jan 1, 1980
86.335
-0.302
-0.35%
jan 1, 1981
88.505
+2.17
2.51%
jan 1, 1982
88.662
+0.157
0.18%
jan 1, 1983
88.504
-0.158
-0.18%
jan 1, 1984
88.497
-0.007
-0.01%
jan 1, 1985
88.815
+0.318
0.36%
jan 1, 1986
88.846
+0.031
0.04%
jan 1, 1987
88.993
+0.147
0.17%
jan 1, 1988
89.255
+0.261
0.29%
jan 1, 1989
89.581
+0.327
0.37%
jan 1, 1990
89.944
+0.362
0.4%
jan 1, 1991
90.42
+0.476
0.53%
jan 1, 1992
91.065
+0.646
0.71%
jan 1, 1993
91.557
+0.492
0.54%
jan 1, 1994
91.983
+0.425
0.46%
jan 1, 1995
91.985
+0.003
0.0%
jan 1, 1996
92.316
+0.331
0.36%
jan 1, 1997
92.87
+0.553
0.6%
jan 1, 1998
93.534
+0.664
0.72%
jan 1, 1999
94.125
+0.591
0.63%
jan 1, 2000
94.36
+0.235
0.25%
jan 1, 2001
94.634
+0.274
0.29%
jan 1, 2002
94.729
+0.095
0.1%
jan 1, 2003
94.773
+0.044
0.05%
jan 1, 2004
94.799
+0.026
0.03%
jan 1, 2005
94.865
+0.066
0.07%
jan 1, 2006
94.839
-0.026
-0.03%
jan 1, 2007
94.717
-0.122
-0.13%
jan 1, 2008
94.351
-0.366
-0.39%
jan 1, 2009
94.393
+0.042
0.04%
jan 1, 2010
94.386
-0.007
-0.01%
jan 1, 2011
94.536
+0.15
0.16%
jan 1, 2012
94.543
+0.007
0.01%
jan 1, 2013
94.606
+0.063
0.07%
jan 1, 2014
94.407
-0.2
-0.21%
Ranking of countries by current statistics by years


Comments: