30
/
AIzaSyAYiBZKx7MnpbEhh9jyipgxe19OcubqV5w
April 1, 2024
236514
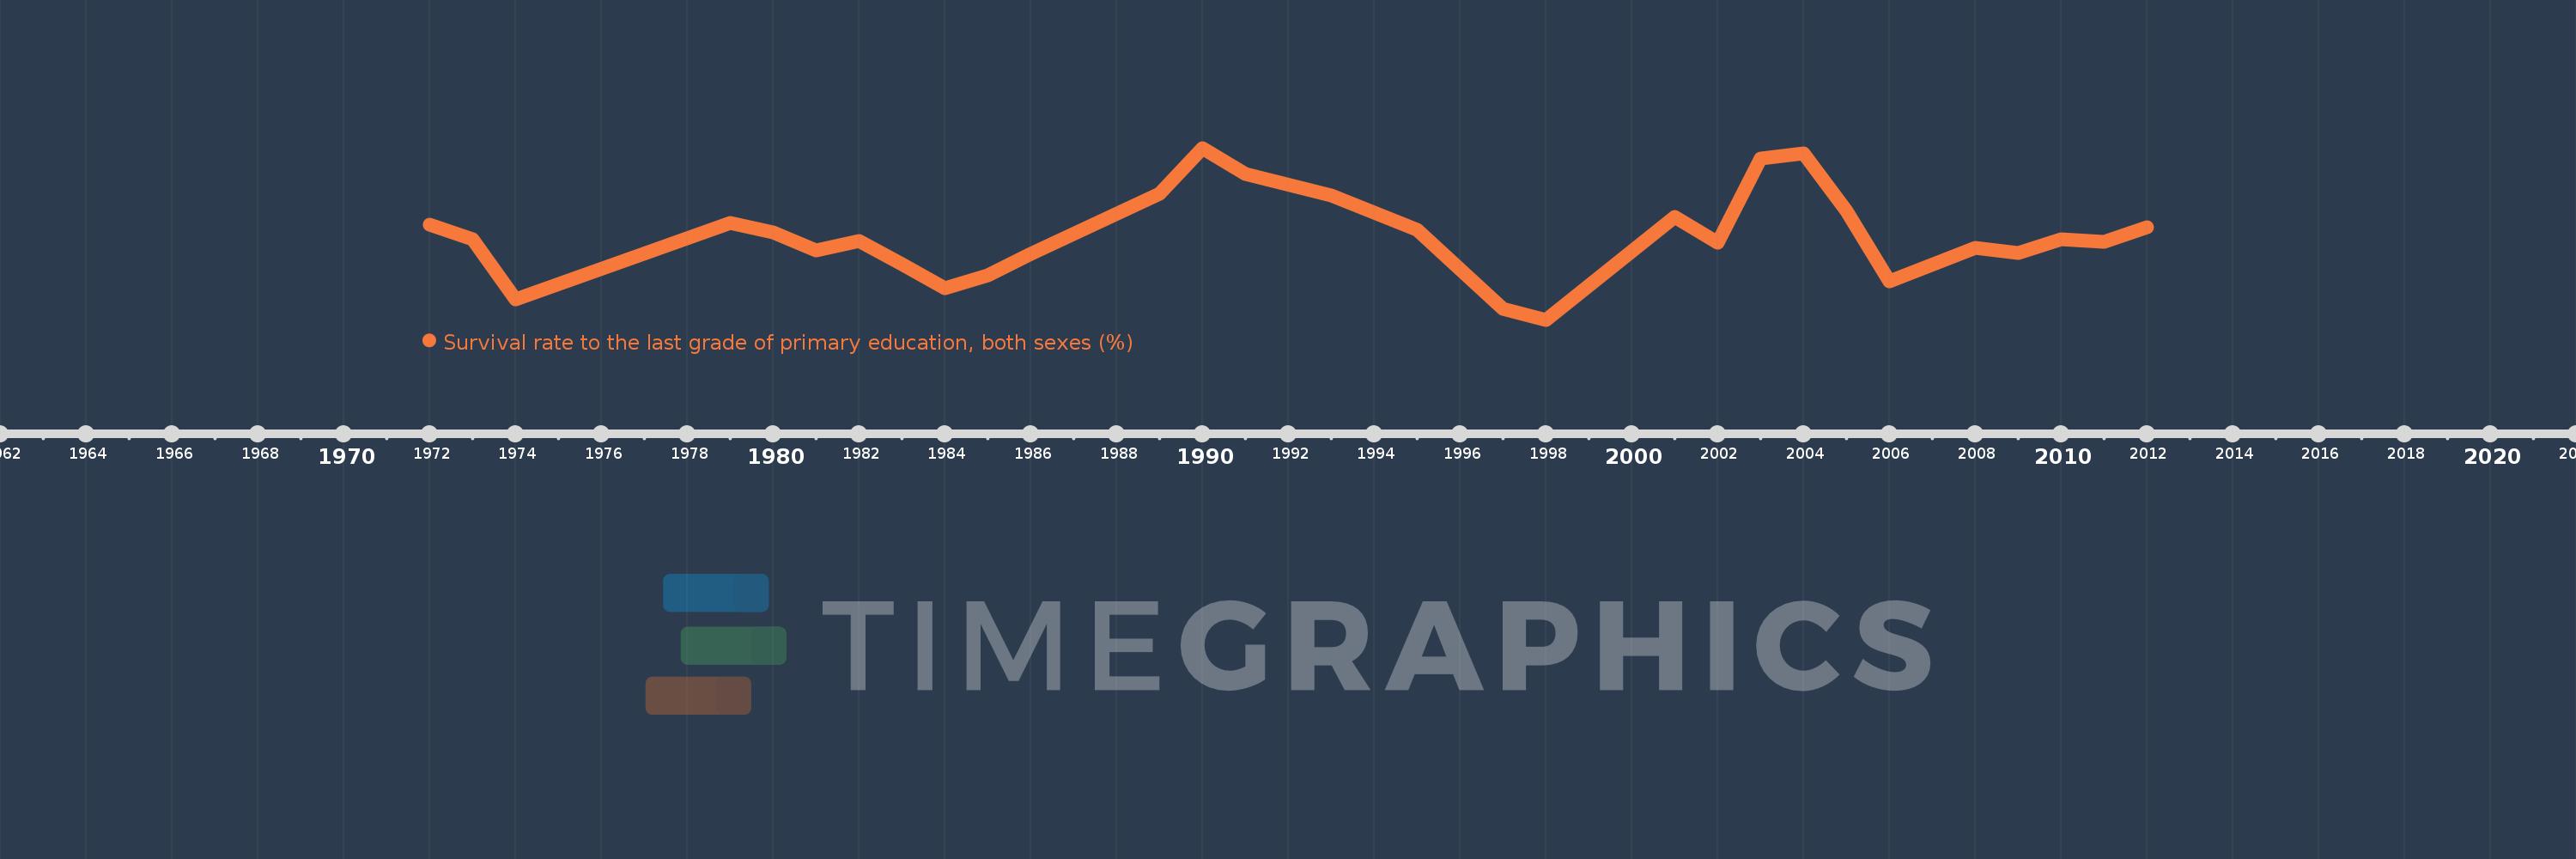
Senegal
SEN
true
2
1
Survival rate to the last grade of primary education, both sexes (%)
2012,2011,2010,2009,2008,2006,2005,2004,2003,2002,2001,1998,1997,1995,1993,1991,1990,1989,1986,1985,1984,1983,1982,1981,1980,1979,1974,1973,1972
