29
/
en
AIzaSyAYiBZKx7MnpbEhh9jyipgxe19OcubqV5w
April 1, 2024
58569
South Asia (IDA & IBRD)
TSA
false
2
1
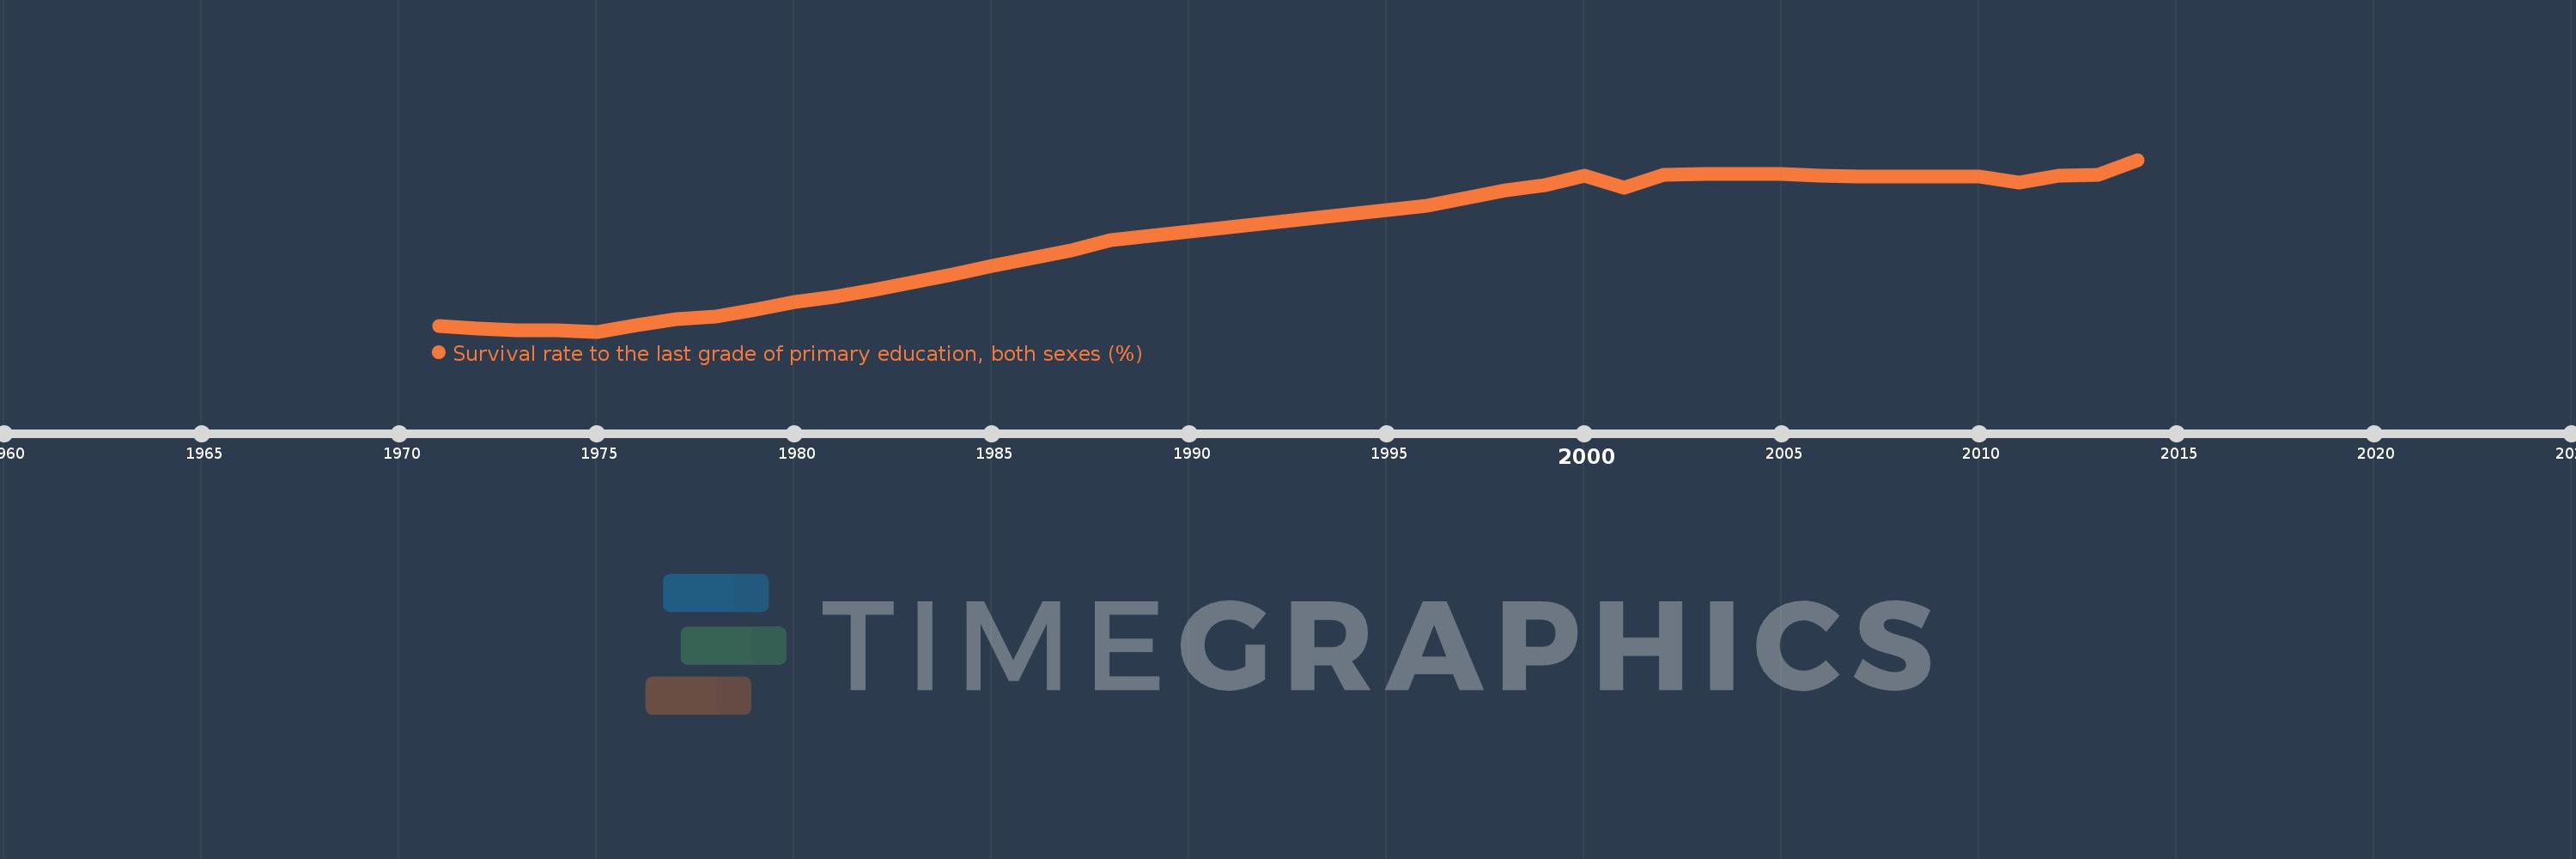
Survival rate to the last grade of primary education, both sexes (%)
2014,2013,2012,2011,2010,2009,2008,2007,2006,2005,2004,2003,2002,2001,2000,1999,1998,1997,1996,1995,1994,1993,1992,1991,1990,1989,1988,1987,1986,1985,1984,1983,1982,1981,1980,1979,1978,1977,1976,1975,1974,1973,1972,1971
This statistics in other country:
AfghanistanAlbaniaAlgeriaAndorraAngolaAntigua and BarbudaArab WorldArgentinaArmeniaArubaAustriaAzerbaijanBahamas, TheBahrainBangladeshBarbadosBelarusBelgiumBelizeBeninBermudaBhutanBoliviaBosnia and HerzegovinaBotswanaBrazilBrunei DarussalamBulgariaBurkina FasoBurundiCabo VerdeCambodiaCameroonCanadaCaribbean small statesCayman IslandsCentral African RepublicCentral Europe and the BalticsChadChileChinaColombiaComorosCongo, Dem. Rep.Congo, Rep.Costa RicaCote d'IvoireCroatiaCubaCyprusCzech RepublicDenmarkDjiboutiDominicaDominican RepublicEarly-demographic dividendEast Asia & PacificEast Asia & Pacific (excluding high income)East Asia & Pacific (IDA & IBRD countries)EcuadorEgypt, Arab Rep.El SalvadorEquatorial GuineaEritreaEstoniaEthiopiaEuro areaEurope & Central AsiaEurope & Central Asia (excluding high income)Europe & Central Asia (IDA & IBRD countries)European UnionFijiFinlandFragile and conflict affected situationsFranceGabonGambia, TheGeorgiaGermanyGhanaGreeceGuatemalaGuineaGuinea-BissauGuyanaHaitiHeavily indebted poor countries (HIPC)High incomeHondurasHong Kong SAR, ChinaHungaryIBRD onlyIcelandIDA & IBRD totalIDA blendIDA onlyIDA totalIndiaIndonesiaIran, Islamic Rep.IraqIsraelItalyJamaicaJapanJordanKazakhstanKenyaKiribatiKorea, Rep.KuwaitKyrgyz RepublicLao PDRLate-demographic dividendLatin America & Caribbean Latin America & Caribbean (excluding high income)Latin America & the Caribbean (IDA & IBRD countries)LatviaLeast developed countries: UN classificationLebanonLesothoLiberiaLibyaLiechtensteinLithuaniaLow & middle incomeLow incomeLower middle incomeLuxembourgMacao SAR, ChinaMacedonia, FYRMadagascarMalawiMalaysiaMaldivesMaliMaltaMarshall IslandsMauritaniaMauritiusMexicoMiddle East & North AfricaMiddle East & North Africa (excluding high income)Middle East & North Africa (IDA & IBRD countries)Middle incomeMoldovaMonacoMongoliaMontenegroMoroccoMozambiqueMyanmarNamibiaNepalNetherlandsNicaraguaNigerNigeriaNorth AmericaNorwayOECD membersOmanOther small statesPacific island small statesPakistanPanamaPapua New GuineaParaguayPeruPhilippinesPolandPortugalPost-demographic dividendPre-demographic dividendQatarRomaniaRussian FederationRwandaSamoaSan MarinoSao Tome and PrincipeSaudi ArabiaSenegalSerbiaSeychellesSierra LeoneSingaporeSlovak RepublicSloveniaSmall statesSolomon IslandsSouth AfricaSouth AsiaSouth Asia (IDA & IBRD)SpainSri LankaSt. Kitts and NevisSt. LuciaSt. Vincent and the GrenadinesSub-Saharan Africa Sub-Saharan Africa (excluding high income)Sub-Saharan Africa (IDA & IBRD countries)SudanSurinameSwazilandSwedenSwitzerlandSyrian Arab RepublicTajikistanTanzaniaThailandTimor-LesteTogoTongaTrinidad and TobagoTunisiaTurkeyUgandaUkraineUnited Arab EmiratesUpper middle incomeUruguayUzbekistanVanuatuVenezuela, RBVietnamWest Bank and GazaWorldYemen, Rep.ZambiaZimbabwe Timeline:
This timeline shows a graph from 1971 to 2014 of South Asia (IDA & IBRD). No data until 1970. Number of actual observations by date: 44.
Source name:
World Development Indicators
Source organization:
UNESCO Institute for Statistics
Categories, topics:
Education
Last updated:
apr 23, 2017
Indicators value changes by year
Minimum:
38.568
jan 1, 1975
Maximum:
65.356
jan 1, 2014
At the date of observation
Value
Absolute change
Change from previous value
jan 1, 1971
39.442
+39.442
0.0%
jan 1, 1972
38.972
-0.47
-1.19%
jan 1, 1973
38.821
-0.151
-0.39%
jan 1, 1974
38.771
-0.049
-0.13%
jan 1, 1975
38.568
-0.203
-0.52%
jan 1, 1976
39.567
+0.999
2.59%
jan 1, 1977
40.508
+0.941
2.38%
jan 1, 1978
40.91
+0.402
0.99%
jan 1, 1979
42.011
+1.101
2.69%
jan 1, 1980
43.174
+1.163
2.77%
jan 1, 1981
44.017
+0.844
1.95%
jan 1, 1982
45.047
+1.03
2.34%
jan 1, 1983
46.299
+1.252
2.78%
jan 1, 1984
47.505
+1.206
2.61%
jan 1, 1985
48.8
+1.295
2.73%
jan 1, 1986
50.049
+1.249
2.56%
jan 1, 1987
51.285
+1.236
2.47%
jan 1, 1988
52.801
+1.516
2.96%
jan 1, 1989
53.53
+0.729
1.38%
jan 1, 1990
54.19
+0.66
1.23%
jan 1, 1991
54.854
+0.664
1.22%
jan 1, 1992
55.47
+0.616
1.12%
jan 1, 1993
56.126
+0.655
1.18%
jan 1, 1994
56.828
+0.702
1.25%
jan 1, 1995
57.528
+0.701
1.23%
jan 1, 1996
58.241
+0.712
1.24%
jan 1, 1997
59.431
+1.19
2.04%
jan 1, 1998
60.581
+1.15
1.93%
jan 1, 1999
61.354
+0.773
1.28%
jan 1, 2000
62.919
+1.565
2.55%
jan 1, 2001
60.952
-1.967
-3.13%
jan 1, 2002
63.052
+2.1
3.45%
jan 1, 2003
63.165
+0.113
0.18%
jan 1, 2004
63.179
+0.014
0.02%
jan 1, 2005
63.089
-0.09
-0.14%
jan 1, 2006
62.924
-0.165
-0.26%
jan 1, 2007
62.81
-0.114
-0.18%
jan 1, 2008
62.744
-0.067
-0.11%
jan 1, 2009
62.731
-0.013
-0.02%
jan 1, 2010
62.756
+0.025
0.04%
jan 1, 2011
61.837
-0.92
-1.47%
jan 1, 2012
62.843
+1.007
1.63%
jan 1, 2013
63.019
+0.175
0.28%
jan 1, 2014
65.356
+2.337
3.71%
Ranking of countries by current statistics by years


Comments: