29
/
en
AIzaSyAYiBZKx7MnpbEhh9jyipgxe19OcubqV5w
April 1, 2024
196314
Mexico
MEX
true
2
1
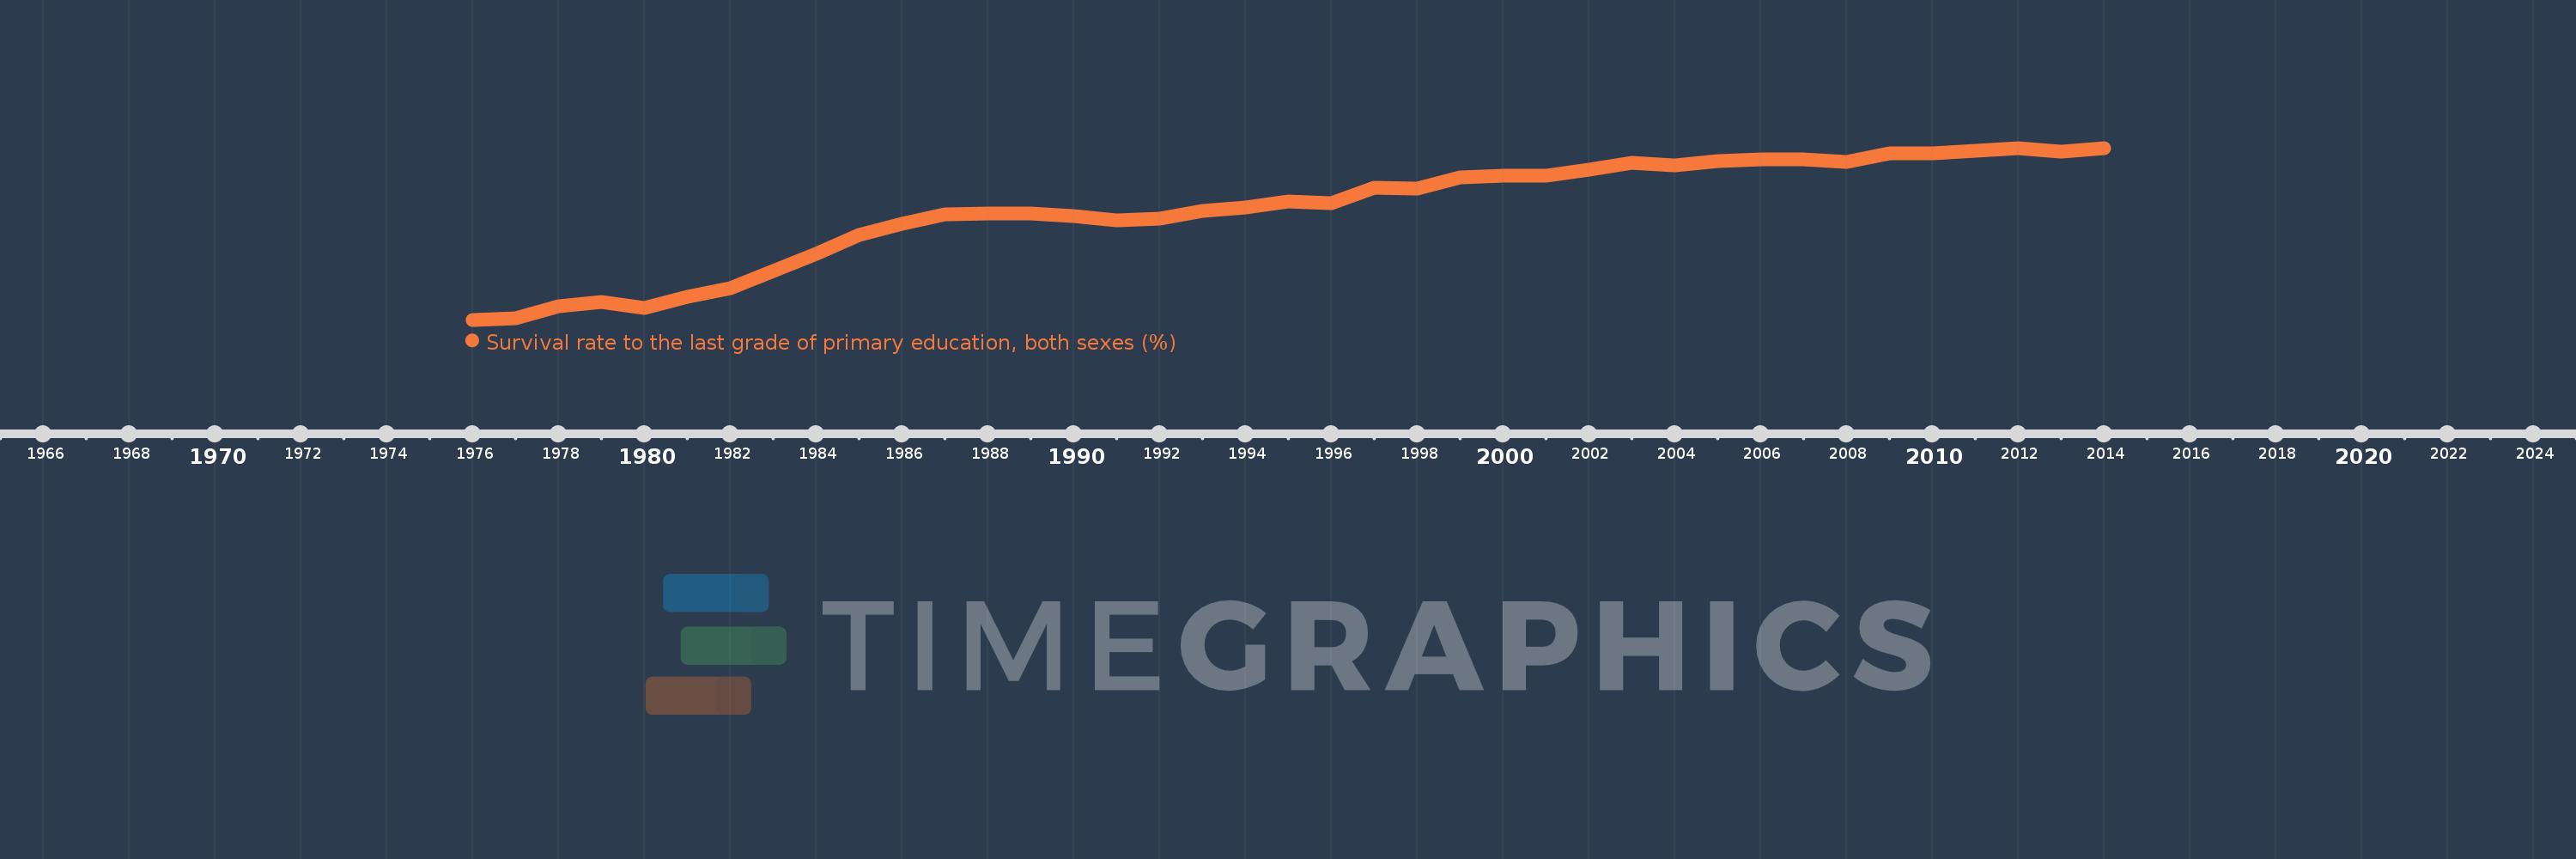
Survival rate to the last grade of primary education, both sexes (%)
2014,2013,2012,2011,2010,2009,2008,2007,2006,2005,2004,2003,2002,2001,2000,1999,1998,1997,1996,1995,1994,1993,1992,1991,1990,1989,1988,1987,1986,1985,1984,1983,1982,1981,1980,1979,1978,1977,1976
This statistics in other country:
AfghanistanAlbaniaAlgeriaAndorraAngolaAntigua and BarbudaArab WorldArgentinaArmeniaArubaAustriaAzerbaijanBahamas, TheBahrainBangladeshBarbadosBelarusBelgiumBelizeBeninBermudaBhutanBoliviaBosnia and HerzegovinaBotswanaBrazilBrunei DarussalamBulgariaBurkina FasoBurundiCabo VerdeCambodiaCameroonCanadaCaribbean small statesCayman IslandsCentral African RepublicCentral Europe and the BalticsChadChileChinaColombiaComorosCongo, Dem. Rep.Congo, Rep.Costa RicaCote d'IvoireCroatiaCubaCyprusCzech RepublicDenmarkDjiboutiDominicaDominican RepublicEarly-demographic dividendEast Asia & PacificEast Asia & Pacific (excluding high income)East Asia & Pacific (IDA & IBRD countries)EcuadorEgypt, Arab Rep.El SalvadorEquatorial GuineaEritreaEstoniaEthiopiaEuro areaEurope & Central AsiaEurope & Central Asia (excluding high income)Europe & Central Asia (IDA & IBRD countries)European UnionFijiFinlandFragile and conflict affected situationsFranceGabonGambia, TheGeorgiaGermanyGhanaGreeceGuatemalaGuineaGuinea-BissauGuyanaHaitiHeavily indebted poor countries (HIPC)High incomeHondurasHong Kong SAR, ChinaHungaryIBRD onlyIcelandIDA & IBRD totalIDA blendIDA onlyIDA totalIndiaIndonesiaIran, Islamic Rep.IraqIsraelItalyJamaicaJapanJordanKazakhstanKenyaKiribatiKorea, Rep.KuwaitKyrgyz RepublicLao PDRLate-demographic dividendLatin America & Caribbean Latin America & Caribbean (excluding high income)Latin America & the Caribbean (IDA & IBRD countries)LatviaLeast developed countries: UN classificationLebanonLesothoLiberiaLibyaLiechtensteinLithuaniaLow & middle incomeLow incomeLower middle incomeLuxembourgMacao SAR, ChinaMacedonia, FYRMadagascarMalawiMalaysiaMaldivesMaliMaltaMarshall IslandsMauritaniaMauritiusMexicoMiddle East & North AfricaMiddle East & North Africa (excluding high income)Middle East & North Africa (IDA & IBRD countries)Middle incomeMoldovaMonacoMongoliaMontenegroMoroccoMozambiqueMyanmarNamibiaNepalNetherlandsNicaraguaNigerNigeriaNorth AmericaNorwayOECD membersOmanOther small statesPacific island small statesPakistanPanamaPapua New GuineaParaguayPeruPhilippinesPolandPortugalPost-demographic dividendPre-demographic dividendQatarRomaniaRussian FederationRwandaSamoaSan MarinoSao Tome and PrincipeSaudi ArabiaSenegalSerbiaSeychellesSierra LeoneSingaporeSlovak RepublicSloveniaSmall statesSolomon IslandsSouth AfricaSouth AsiaSouth Asia (IDA & IBRD)SpainSri LankaSt. Kitts and NevisSt. LuciaSt. Vincent and the GrenadinesSub-Saharan Africa Sub-Saharan Africa (excluding high income)Sub-Saharan Africa (IDA & IBRD countries)SudanSurinameSwazilandSwedenSwitzerlandSyrian Arab RepublicTajikistanTanzaniaThailandTimor-LesteTogoTongaTrinidad and TobagoTunisiaTurkeyUgandaUkraineUnited Arab EmiratesUpper middle incomeUruguayUzbekistanVanuatuVenezuela, RBVietnamWest Bank and GazaWorldYemen, Rep.ZambiaZimbabwe Timeline:
This timeline shows a graph from 1976 to 2014 of Mexico. No data until 1975. Number of actual observations by date: 39.
Source name:
World Development Indicators
Source organization:
UNESCO Institute for Statistics
Categories, topics:
Education
Last updated:
apr 23, 2017
Indicators value changes by year
Minimum:
42.897
jan 1, 1976
Maximum:
95.753
jan 1, 2012
At the date of observation
Value
Absolute change
Change from previous value
jan 1, 1976
42.897
+42.897
0.0%
jan 1, 1977
43.346
+0.449
1.05%
jan 1, 1978
47.154
+3.808
8.79%
jan 1, 1979
48.252
+1.098
2.33%
jan 1, 1980
46.562
-1.69
-3.5%
jan 1, 1981
50.01
+3.448
7.4%
jan 1, 1982
52.666
+2.656
5.31%
jan 1, 1983
57.826
+5.16
9.8%
jan 1, 1984
63.071
+5.245
9.07%
jan 1, 1985
69.003
+5.932
9.4%
jan 1, 1986
72.357
+3.354
4.86%
jan 1, 1987
75.386
+3.029
4.19%
jan 1, 1988
75.546
+0.16
0.21%
jan 1, 1989
75.509
-0.037
-0.05%
jan 1, 1990
74.745
-0.764
-1.01%
jan 1, 1991
73.484
-1.261
-1.69%
jan 1, 1992
73.931
+0.448
0.61%
jan 1, 1993
76.349
+2.418
3.27%
jan 1, 1994
77.316
+0.967
1.27%
jan 1, 1995
79.413
+2.097
2.71%
jan 1, 1996
78.73
-0.683
-0.86%
jan 1, 1997
83.539
+4.809
6.11%
jan 1, 1998
83.19
-0.349
-0.42%
jan 1, 1999
86.746
+3.556
4.27%
jan 1, 2000
87.225
+0.479
0.55%
jan 1, 2001
87.152
-0.073
-0.08%
jan 1, 2002
88.99
+1.838
2.11%
jan 1, 2003
91.154
+2.164
2.43%
jan 1, 2004
90.384
-0.771
-0.85%
jan 1, 2005
91.624
+1.24
1.37%
jan 1, 2006
92.135
+0.511
0.56%
jan 1, 2007
92.349
+0.213
0.23%
jan 1, 2008
91.513
-0.836
-0.91%
jan 1, 2009
94.01
+2.498
2.73%
jan 1, 2010
94.152
+0.142
0.15%
jan 1, 2011
95.005
+0.853
0.91%
jan 1, 2012
95.753
+0.747
0.79%
jan 1, 2013
94.573
-1.18
-1.23%
jan 1, 2014
95.713
+1.14
1.21%
Ranking of countries by current statistics by years


Comments: