29
/
en
AIzaSyAYiBZKx7MnpbEhh9jyipgxe19OcubqV5w
April 1, 2024
37027
IBRD only
IBD
false
2
1
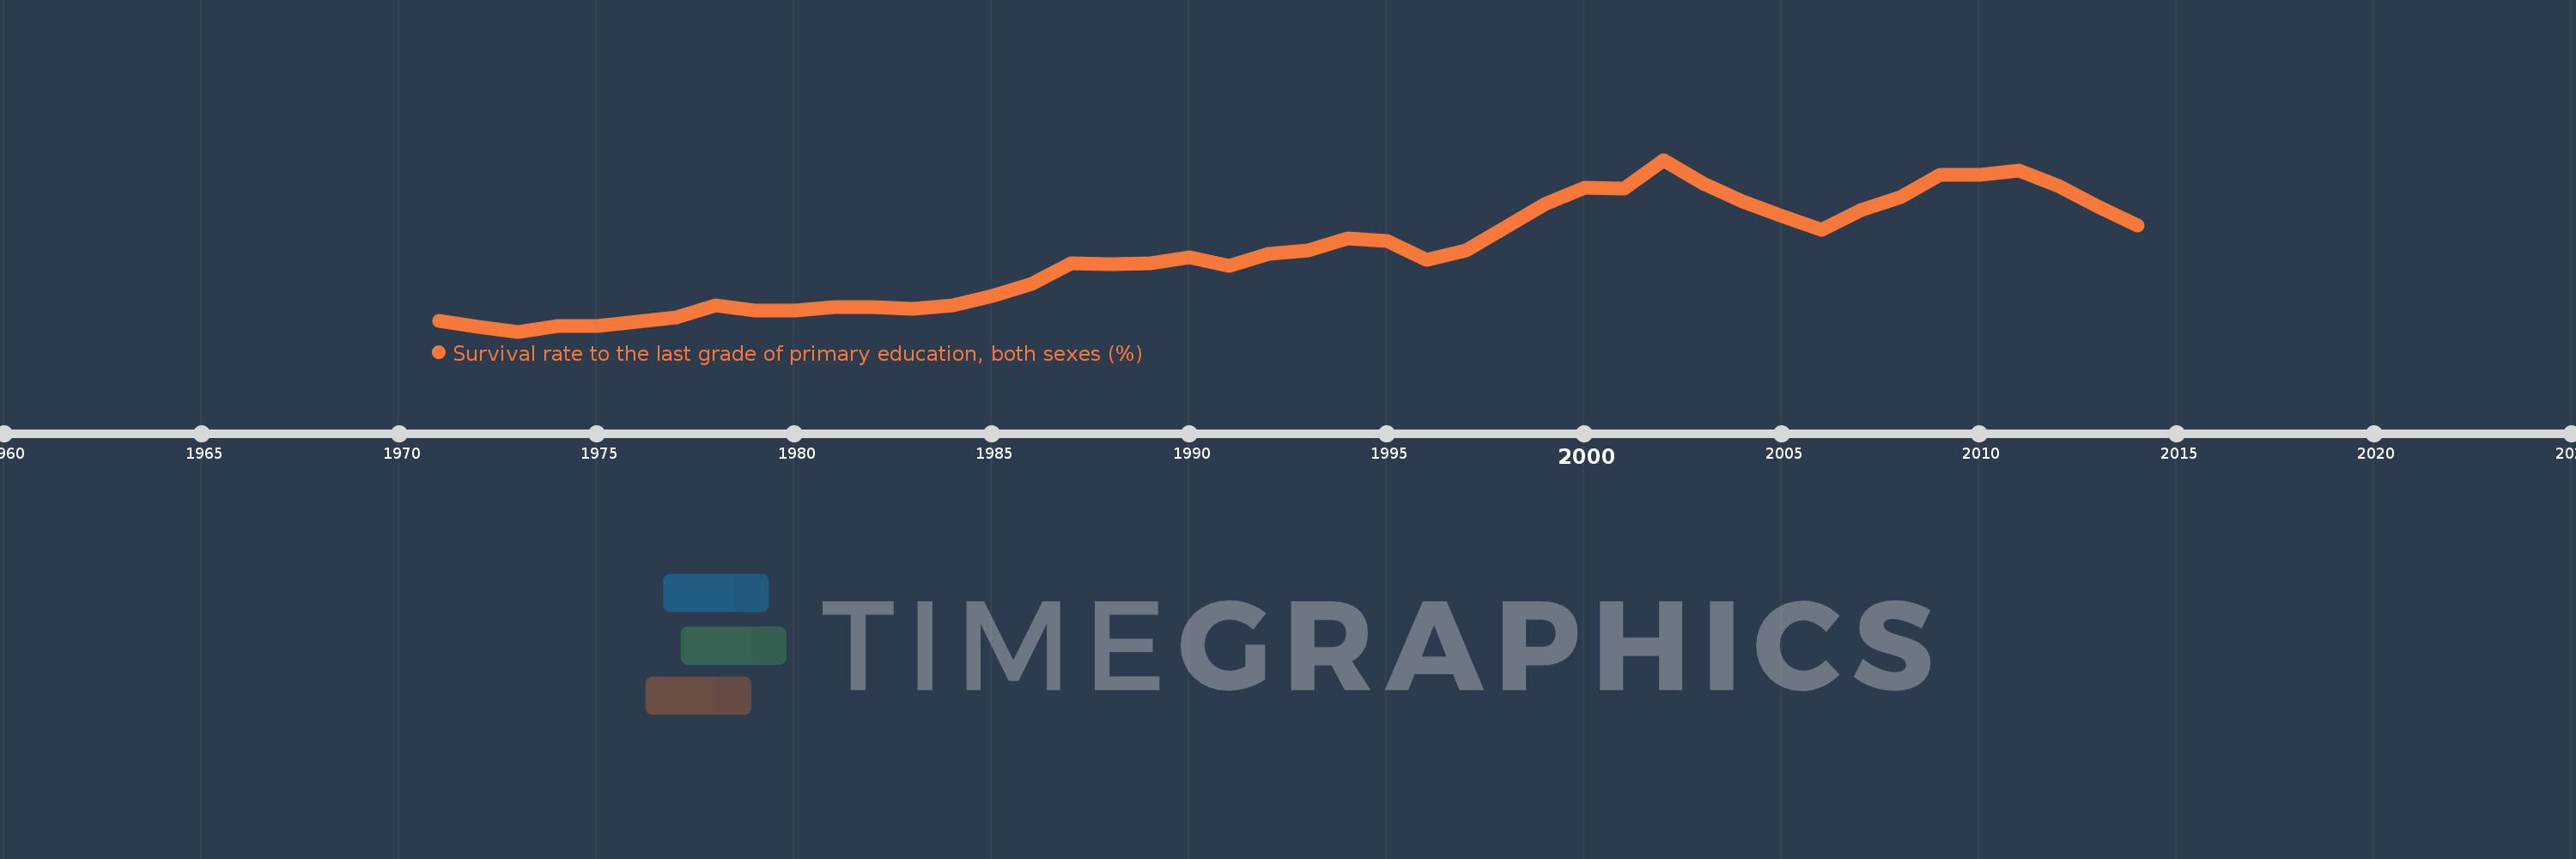
Survival rate to the last grade of primary education, both sexes (%)
2014,2013,2012,2011,2010,2009,2008,2007,2006,2005,2004,2003,2002,2001,2000,1999,1998,1997,1996,1995,1994,1993,1992,1991,1990,1989,1988,1987,1986,1985,1984,1983,1982,1981,1980,1979,1978,1977,1976,1975,1974,1973,1972,1971
This statistics in other country:
AfghanistanAlbaniaAlgeriaAndorraAngolaAntigua and BarbudaArab WorldArgentinaArmeniaArubaAustriaAzerbaijanBahamas, TheBahrainBangladeshBarbadosBelarusBelgiumBelizeBeninBermudaBhutanBoliviaBosnia and HerzegovinaBotswanaBrazilBrunei DarussalamBulgariaBurkina FasoBurundiCabo VerdeCambodiaCameroonCanadaCaribbean small statesCayman IslandsCentral African RepublicCentral Europe and the BalticsChadChileChinaColombiaComorosCongo, Dem. Rep.Congo, Rep.Costa RicaCote d'IvoireCroatiaCubaCyprusCzech RepublicDenmarkDjiboutiDominicaDominican RepublicEarly-demographic dividendEast Asia & PacificEast Asia & Pacific (excluding high income)East Asia & Pacific (IDA & IBRD countries)EcuadorEgypt, Arab Rep.El SalvadorEquatorial GuineaEritreaEstoniaEthiopiaEuro areaEurope & Central AsiaEurope & Central Asia (excluding high income)Europe & Central Asia (IDA & IBRD countries)European UnionFijiFinlandFragile and conflict affected situationsFranceGabonGambia, TheGeorgiaGermanyGhanaGreeceGuatemalaGuineaGuinea-BissauGuyanaHaitiHeavily indebted poor countries (HIPC)High incomeHondurasHong Kong SAR, ChinaHungaryIBRD onlyIcelandIDA & IBRD totalIDA blendIDA onlyIDA totalIndiaIndonesiaIran, Islamic Rep.IraqIsraelItalyJamaicaJapanJordanKazakhstanKenyaKiribatiKorea, Rep.KuwaitKyrgyz RepublicLao PDRLate-demographic dividendLatin America & Caribbean Latin America & Caribbean (excluding high income)Latin America & the Caribbean (IDA & IBRD countries)LatviaLeast developed countries: UN classificationLebanonLesothoLiberiaLibyaLiechtensteinLithuaniaLow & middle incomeLow incomeLower middle incomeLuxembourgMacao SAR, ChinaMacedonia, FYRMadagascarMalawiMalaysiaMaldivesMaliMaltaMarshall IslandsMauritaniaMauritiusMexicoMiddle East & North AfricaMiddle East & North Africa (excluding high income)Middle East & North Africa (IDA & IBRD countries)Middle incomeMoldovaMonacoMongoliaMontenegroMoroccoMozambiqueMyanmarNamibiaNepalNetherlandsNicaraguaNigerNigeriaNorth AmericaNorwayOECD membersOmanOther small statesPacific island small statesPakistanPanamaPapua New GuineaParaguayPeruPhilippinesPolandPortugalPost-demographic dividendPre-demographic dividendQatarRomaniaRussian FederationRwandaSamoaSan MarinoSao Tome and PrincipeSaudi ArabiaSenegalSerbiaSeychellesSierra LeoneSingaporeSlovak RepublicSloveniaSmall statesSolomon IslandsSouth AfricaSouth AsiaSouth Asia (IDA & IBRD)SpainSri LankaSt. Kitts and NevisSt. LuciaSt. Vincent and the GrenadinesSub-Saharan Africa Sub-Saharan Africa (excluding high income)Sub-Saharan Africa (IDA & IBRD countries)SudanSurinameSwazilandSwedenSwitzerlandSyrian Arab RepublicTajikistanTanzaniaThailandTimor-LesteTogoTongaTrinidad and TobagoTunisiaTurkeyUgandaUkraineUnited Arab EmiratesUpper middle incomeUruguayUzbekistanVanuatuVenezuela, RBVietnamWest Bank and GazaWorldYemen, Rep.ZambiaZimbabwe Timeline:
This timeline shows a graph from 1971 to 2014 of IBRD only. No data until 1970. Number of actual observations by date: 44.
Source name:
World Development Indicators
Source organization:
UNESCO Institute for Statistics
Categories, topics:
Education
Last updated:
apr 23, 2017
Indicators value changes by year
Minimum:
65.118
jan 1, 1973
Maximum:
79.384
jan 1, 2002
At the date of observation
Value
Absolute change
Change from previous value
jan 1, 1971
66.019
+66.019
0.0%
jan 1, 1972
65.539
-0.48
-0.73%
jan 1, 1973
65.118
-0.421
-0.64%
jan 1, 1974
65.599
+0.48
0.74%
jan 1, 1975
65.549
-0.05
-0.08%
jan 1, 1976
65.952
+0.403
0.62%
jan 1, 1977
66.283
+0.33
0.5%
jan 1, 1978
67.29
+1.007
1.52%
jan 1, 1979
66.842
-0.448
-0.67%
jan 1, 1980
66.869
+0.027
0.04%
jan 1, 1981
67.131
+0.262
0.39%
jan 1, 1982
67.173
+0.042
0.06%
jan 1, 1983
66.984
-0.189
-0.28%
jan 1, 1984
67.292
+0.309
0.46%
jan 1, 1985
68.106
+0.813
1.21%
jan 1, 1986
69.052
+0.946
1.39%
jan 1, 1987
70.81
+1.758
2.55%
jan 1, 1988
70.697
-0.113
-0.16%
jan 1, 1989
70.814
+0.118
0.17%
jan 1, 1990
71.319
+0.505
0.71%
jan 1, 1991
70.567
-0.753
-1.06%
jan 1, 1992
71.598
+1.031
1.46%
jan 1, 1993
71.871
+0.273
0.38%
jan 1, 1994
72.825
+0.953
1.33%
jan 1, 1995
72.657
-0.168
-0.23%
jan 1, 1996
71.074
-1.582
-2.18%
jan 1, 1997
71.89
+0.816
1.15%
jan 1, 1998
73.753
+1.863
2.59%
jan 1, 1999
75.694
+1.941
2.63%
jan 1, 2000
77.031
+1.337
1.77%
jan 1, 2001
77.022
-0.009
-0.01%
jan 1, 2002
79.384
+2.362
3.07%
jan 1, 2003
77.449
-1.935
-2.44%
jan 1, 2004
75.955
-1.494
-1.93%
jan 1, 2005
74.725
-1.23
-1.62%
jan 1, 2006
73.548
-1.177
-1.58%
jan 1, 2007
75.177
+1.629
2.21%
jan 1, 2008
76.299
+1.122
1.49%
jan 1, 2009
78.153
+1.853
2.43%
jan 1, 2010
78.17
+0.018
0.02%
jan 1, 2011
78.513
+0.343
0.44%
jan 1, 2012
77.178
-1.335
-1.7%
jan 1, 2013
75.514
-1.664
-2.16%
jan 1, 2014
73.947
-1.566
-2.07%
Ranking of countries by current statistics by years


Comments: