29
/
en
AIzaSyAYiBZKx7MnpbEhh9jyipgxe19OcubqV5w
April 1, 2024
175914
Latvia
LVA
true
2
1
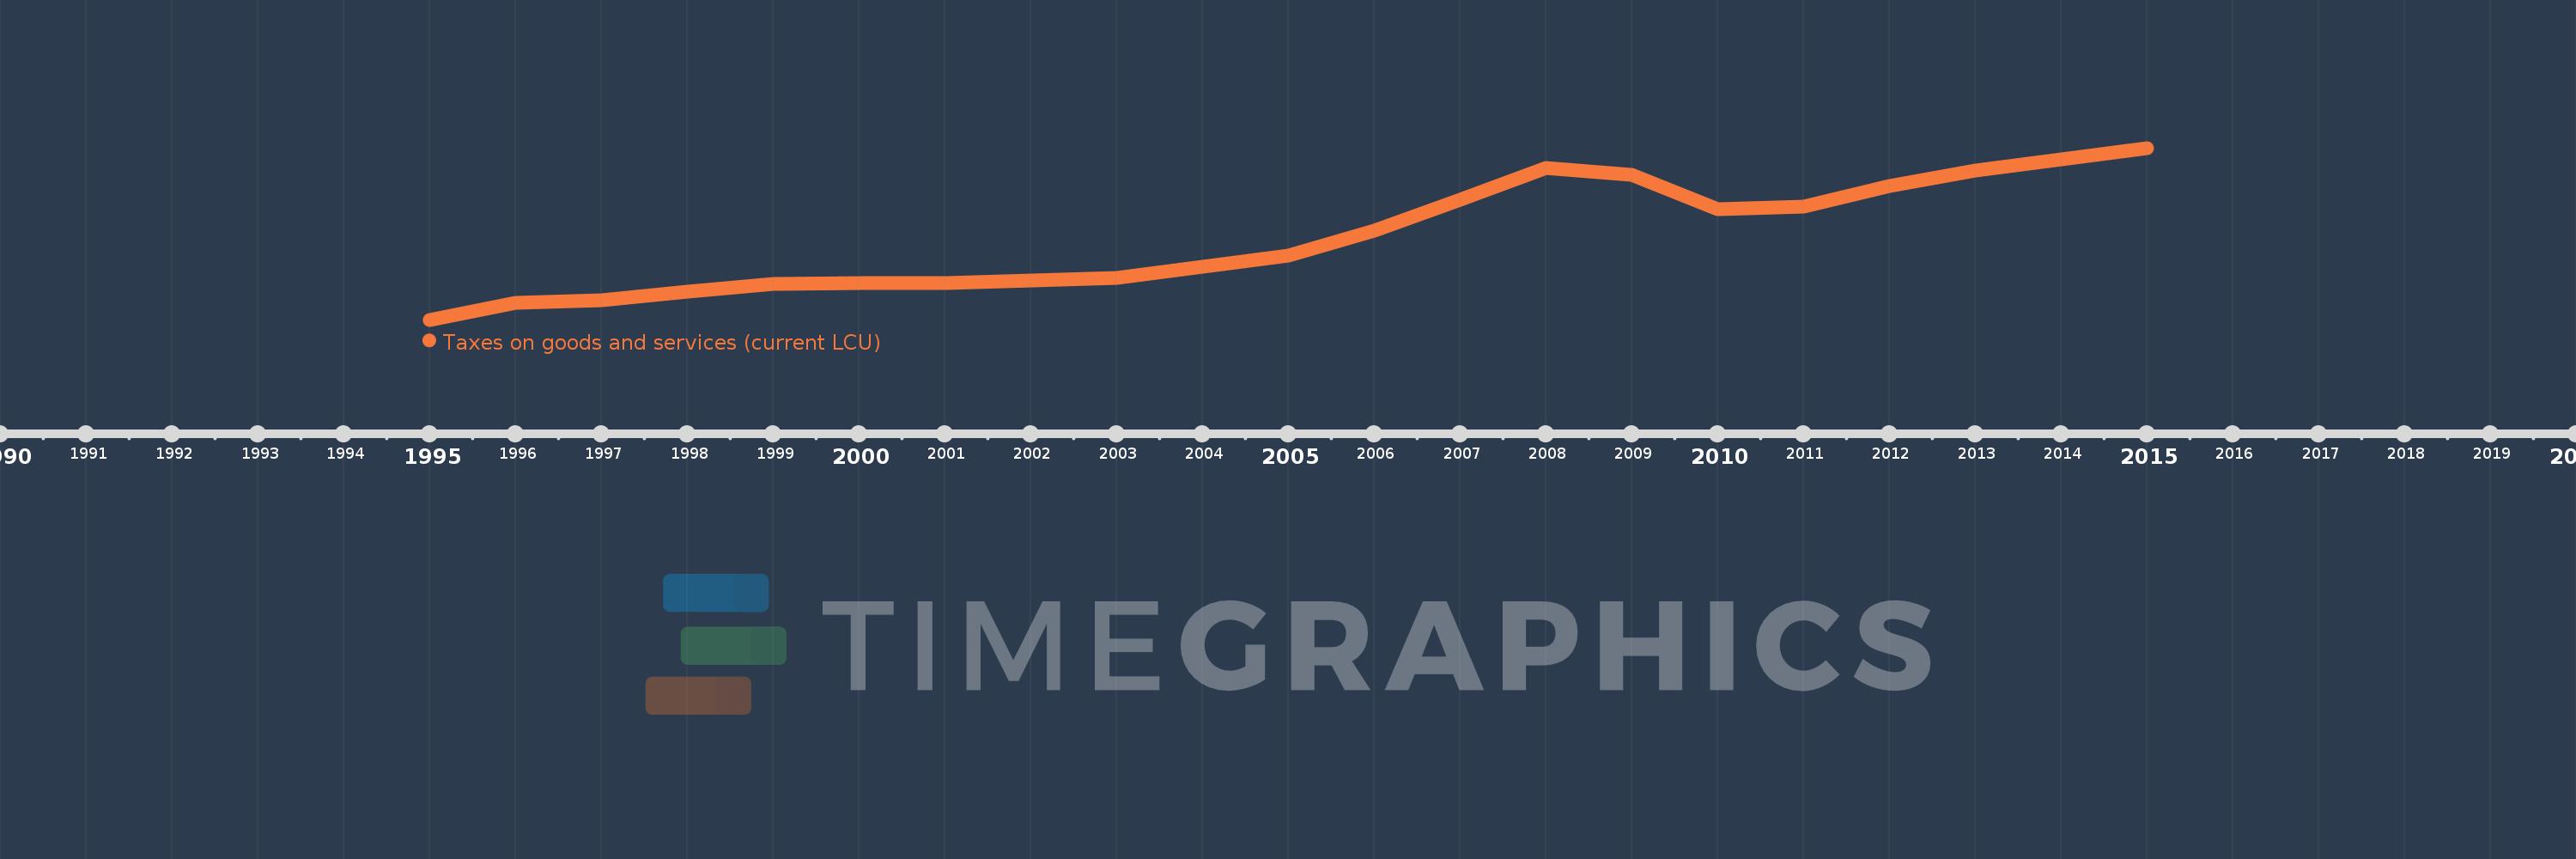
Taxes on goods and services (current LCU)
2015,2014,2013,2012,2011,2010,2009,2008,2007,2006,2005,2004,2003,2002,2001,2000,1999,1998,1997,1996,1995
This statistics in other country:
AfghanistanAlbaniaAlgeriaAngolaAntigua and BarbudaArgentinaArmeniaAustraliaAustriaAzerbaijanBahamas, TheBahrainBangladeshBarbadosBelarusBelgiumBelizeBeninBhutanBoliviaBosnia and HerzegovinaBotswanaBrazilBulgariaBurkina FasoBurundiCabo VerdeCambodiaCanadaCentral African RepublicChileChinaColombiaCongo, Dem. Rep.Congo, Rep.Costa RicaCote d'IvoireCroatiaCyprusCzech RepublicDenmarkDominicaDominican RepublicEgypt, Arab Rep.El SalvadorEquatorial GuineaEstoniaEthiopiaFijiFinlandFranceGambia, TheGeorgiaGermanyGhanaGreeceGrenadaGuatemalaHondurasHong Kong SAR, ChinaHungaryIcelandIndiaIndonesiaIran, Islamic Rep.IraqIrelandIsraelItalyJamaicaJapanJordanKazakhstanKenyaKiribatiKorea, Rep.KuwaitKyrgyz RepublicLao PDRLatviaLebanonLesothoLiberiaLithuaniaLuxembourgMacao SAR, ChinaMacedonia, FYRMadagascarMalawiMalaysiaMaldivesMaliMaltaMauritiusMexicoMicronesia, Fed. Sts.MoldovaMongoliaMoroccoMozambiqueMyanmarNamibiaNepalNetherlandsNew ZealandNicaraguaNigeriaNorwayOmanPakistanPanamaPapua New GuineaParaguayPeruPhilippinesPolandPortugalRomaniaRussian FederationRwandaSamoaSan MarinoSao Tome and PrincipeSenegalSerbiaSeychellesSierra LeoneSingaporeSlovak RepublicSloveniaSolomon IslandsSouth AfricaSpainSri LankaSt. Kitts and NevisSt. LuciaSurinameSwazilandSwedenSwitzerlandSyrian Arab RepublicTajikistanTanzaniaThailandTimor-LesteTogoTrinidad and TobagoTunisiaTurkeyUgandaUkraineUnited Arab EmiratesUnited KingdomUnited StatesUruguayVanuatuVenezuela, RBVietnamWest Bank and GazaYemen, Rep.ZambiaZimbabwe Timeline:
This timeline shows a graph from 1995 to 2015 of Latvia. No data until 1994. Number of actual observations by date: 21.
Source name:
World Development Indicators
Source organization:
International Monetary Fund, Government Finance Statistics Yearbook and data files.
Categories, topics:
Public Sector
Last updated:
apr 23, 2017
Indicators value changes by year
Minimum:
290.081 mln
jan 1, 1995
Maximum:
4.002 bln
jan 1, 2015
At the date of observation
Value
Absolute change
Change from previous value
jan 1, 1995
290.081 mln
+290.081 mln
0.0%
jan 1, 1996
651.917 mln
+361.836 mln
124.74%
jan 1, 1997
719.774 mln
+67.857 mln
10.41%
jan 1, 1998
891.828 mln
+172.054 mln
23.9%
jan 1, 1999
1.073 bln
+181.388 mln
20.34%
jan 1, 2000
1.075 bln
+1.366 mln
0.13%
jan 1, 2001
1.078 bln
+2.96 mln
0.28%
jan 1, 2002
1.132 bln
+54.61 mln
5.07%
jan 1, 2003
1.201 bln
+68.497 mln
6.05%
jan 1, 2004
1.437 bln
+236.311 mln
19.68%
jan 1, 2005
1.673 bln
+236.154 mln
16.43%
jan 1, 2006
2.218 bln
+545.344 mln
32.59%
jan 1, 2007
2.882 bln
+663.528 mln
29.91%
jan 1, 2008
3.569 bln
+686.521 mln
23.82%
jan 1, 2009
3.421 bln
-147.993 mln
-4.15%
jan 1, 2010
2.678 bln
-742.412 mln
-21.7%
jan 1, 2011
2.738 bln
+60.059 mln
2.24%
jan 1, 2012
3.172 bln
+433.393 mln
15.83%
jan 1, 2013
3.516 bln
+344.235 mln
10.85%
jan 1, 2014
3.747 bln
+231.587 mln
6.59%
jan 1, 2015
4.002 bln
+254.779 mln
6.8%
Ranking of countries by current statistics by years


Comments: