29
/
en
AIzaSyAYiBZKx7MnpbEhh9jyipgxe19OcubqV5w
April 1, 2024
204779
Myanmar
MMR
true
2
1
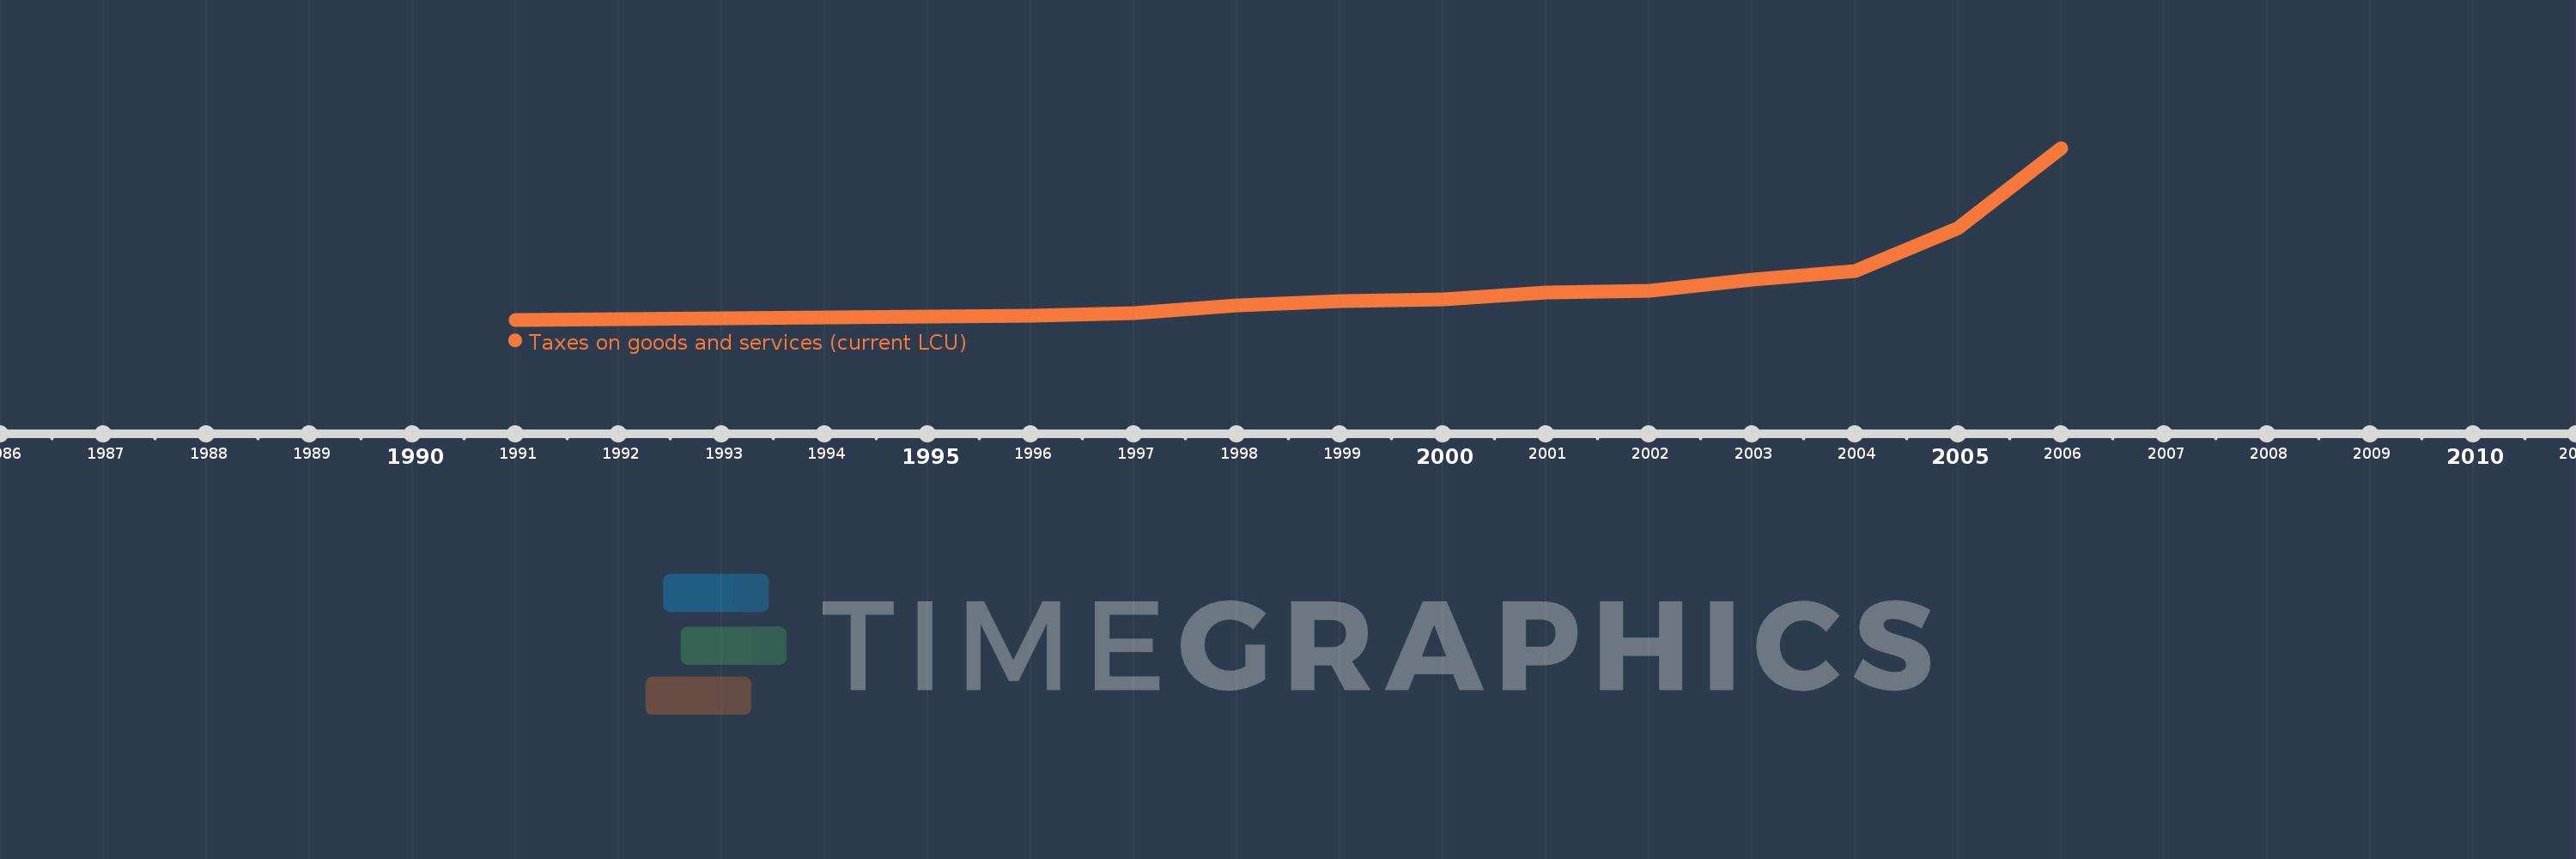
Taxes on goods and services (current LCU)
2006,2005,2004,2003,2002,2001,2000,1999,1998,1997,1996,1995,1994,1993,1992,1991
This statistics in other country:
AfghanistanAlbaniaAlgeriaAngolaAntigua and BarbudaArgentinaArmeniaAustraliaAustriaAzerbaijanBahamas, TheBahrainBangladeshBarbadosBelarusBelgiumBelizeBeninBhutanBoliviaBosnia and HerzegovinaBotswanaBrazilBulgariaBurkina FasoBurundiCabo VerdeCambodiaCanadaCentral African RepublicChileChinaColombiaCongo, Dem. Rep.Congo, Rep.Costa RicaCote d'IvoireCroatiaCyprusCzech RepublicDenmarkDominicaDominican RepublicEgypt, Arab Rep.El SalvadorEquatorial GuineaEstoniaEthiopiaFijiFinlandFranceGambia, TheGeorgiaGermanyGhanaGreeceGrenadaGuatemalaHondurasHong Kong SAR, ChinaHungaryIcelandIndiaIndonesiaIran, Islamic Rep.IraqIrelandIsraelItalyJamaicaJapanJordanKazakhstanKenyaKiribatiKorea, Rep.KuwaitKyrgyz RepublicLao PDRLatviaLebanonLesothoLiberiaLithuaniaLuxembourgMacao SAR, ChinaMacedonia, FYRMadagascarMalawiMalaysiaMaldivesMaliMaltaMauritiusMexicoMicronesia, Fed. Sts.MoldovaMongoliaMoroccoMozambiqueMyanmarNamibiaNepalNetherlandsNew ZealandNicaraguaNigeriaNorwayOmanPakistanPanamaPapua New GuineaParaguayPeruPhilippinesPolandPortugalRomaniaRussian FederationRwandaSamoaSan MarinoSao Tome and PrincipeSenegalSerbiaSeychellesSierra LeoneSingaporeSlovak RepublicSloveniaSolomon IslandsSouth AfricaSpainSri LankaSt. Kitts and NevisSt. LuciaSurinameSwazilandSwedenSwitzerlandSyrian Arab RepublicTajikistanTanzaniaThailandTimor-LesteTogoTrinidad and TobagoTunisiaTurkeyUgandaUkraineUnited Arab EmiratesUnited KingdomUnited StatesUruguayVanuatuVenezuela, RBVietnamWest Bank and GazaYemen, Rep.ZambiaZimbabwe Timeline:
This timeline shows a graph from 1991 to 2006 of Myanmar. No data until 1990. Number of actual observations by date: 16.
Source name:
World Development Indicators
Source organization:
International Monetary Fund, Government Finance Statistics Yearbook and data files.
Categories, topics:
Public Sector
Last updated:
apr 23, 2017
Indicators value changes by year
Minimum:
4.418 bln
jan 1, 1991
Maximum:
251.821 bln
jan 1, 2006
At the date of observation
Value
Absolute change
Change from previous value
jan 1, 1991
4.418 bln
+4.418 bln
0.0%
jan 1, 1992
5.646 bln
+1.228 bln
27.8%
jan 1, 1993
6.463 bln
+817.0 mln
14.47%
jan 1, 1994
8.257 bln
+1.794 bln
27.76%
jan 1, 1995
9.135 bln
+878.0 mln
10.63%
jan 1, 1996
10.168 bln
+1.033 bln
11.31%
jan 1, 1997
14.112 bln
+3.944 bln
38.79%
jan 1, 1998
25.4 bln
+11.288 bln
79.99%
jan 1, 1999
30.748 bln
+5.348 bln
21.06%
jan 1, 2000
33.75 bln
+3.002 bln
9.76%
jan 1, 2001
44.101 bln
+10.351 bln
30.67%
jan 1, 2002
45.506 bln
+1.405 bln
3.19%
jan 1, 2003
61.68 bln
+16.174 bln
35.54%
jan 1, 2004
74.107 bln
+12.427 bln
20.15%
jan 1, 2005
136.626 bln
+62.519 bln
84.36%
jan 1, 2006
251.821 bln
+115.195 bln
84.31%
Ranking of countries by current statistics by years


Comments: