29
/
en
AIzaSyAYiBZKx7MnpbEhh9jyipgxe19OcubqV5w
April 1, 2024
172259
Kuwait
KWT
true
2
1
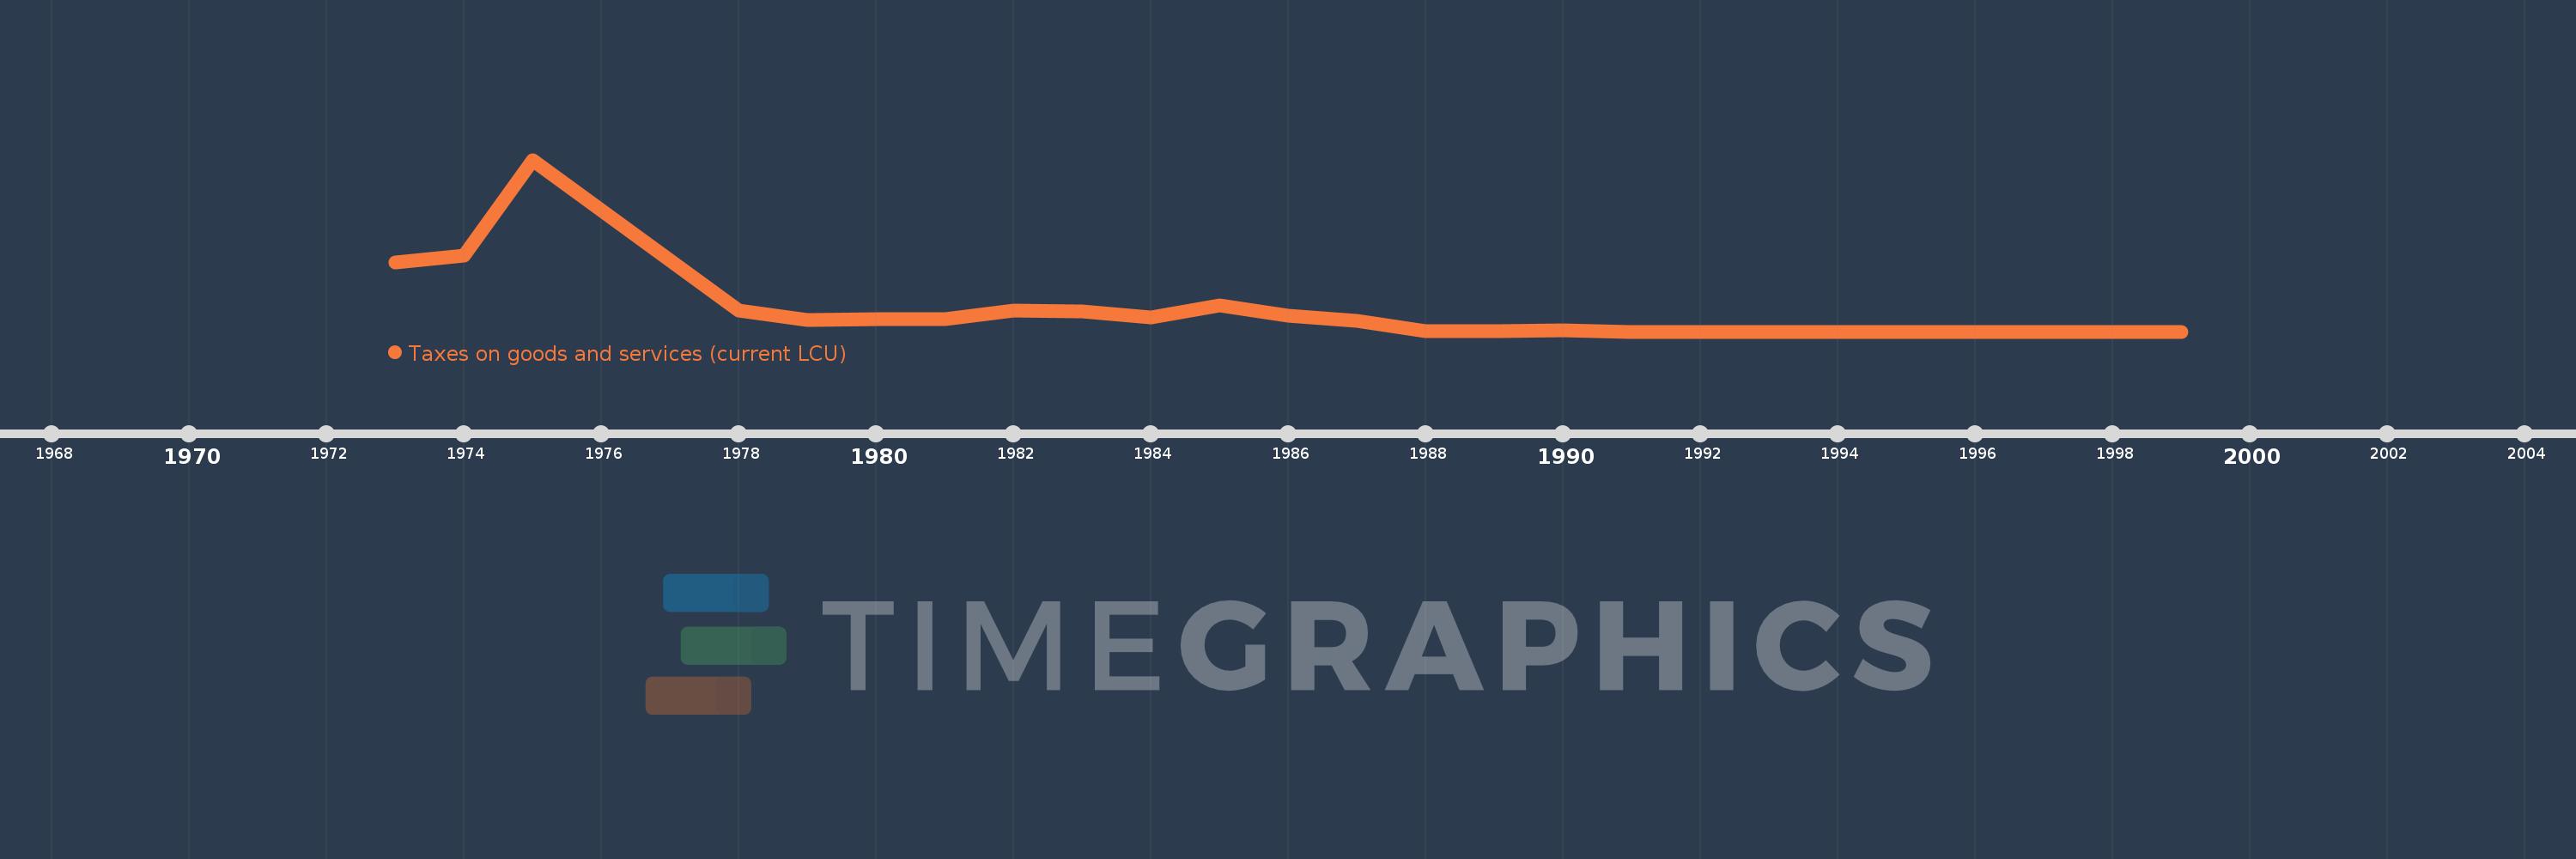
Taxes on goods and services (current LCU)
1999,1998,1996,1995,1994,1993,1991,1990,1989,1988,1987,1986,1985,1984,1983,1982,1981,1980,1979,1978,1975,1974,1973
This statistics in other country:
AfghanistanAlbaniaAlgeriaAngolaAntigua and BarbudaArgentinaArmeniaAustraliaAustriaAzerbaijanBahamas, TheBahrainBangladeshBarbadosBelarusBelgiumBelizeBeninBhutanBoliviaBosnia and HerzegovinaBotswanaBrazilBulgariaBurkina FasoBurundiCabo VerdeCambodiaCanadaCentral African RepublicChileChinaColombiaCongo, Dem. Rep.Congo, Rep.Costa RicaCote d'IvoireCroatiaCyprusCzech RepublicDenmarkDominicaDominican RepublicEgypt, Arab Rep.El SalvadorEquatorial GuineaEstoniaEthiopiaFijiFinlandFranceGambia, TheGeorgiaGermanyGhanaGreeceGrenadaGuatemalaHondurasHong Kong SAR, ChinaHungaryIcelandIndiaIndonesiaIran, Islamic Rep.IraqIrelandIsraelItalyJamaicaJapanJordanKazakhstanKenyaKiribatiKorea, Rep.KuwaitKyrgyz RepublicLao PDRLatviaLebanonLesothoLiberiaLithuaniaLuxembourgMacao SAR, ChinaMacedonia, FYRMadagascarMalawiMalaysiaMaldivesMaliMaltaMauritiusMexicoMicronesia, Fed. Sts.MoldovaMongoliaMoroccoMozambiqueMyanmarNamibiaNepalNetherlandsNew ZealandNicaraguaNigeriaNorwayOmanPakistanPanamaPapua New GuineaParaguayPeruPhilippinesPolandPortugalRomaniaRussian FederationRwandaSamoaSan MarinoSao Tome and PrincipeSenegalSerbiaSeychellesSierra LeoneSingaporeSlovak RepublicSloveniaSolomon IslandsSouth AfricaSpainSri LankaSt. Kitts and NevisSt. LuciaSurinameSwazilandSwedenSwitzerlandSyrian Arab RepublicTajikistanTanzaniaThailandTimor-LesteTogoTrinidad and TobagoTunisiaTurkeyUgandaUkraineUnited Arab EmiratesUnited KingdomUnited StatesUruguayVanuatuVenezuela, RBVietnamWest Bank and GazaYemen, Rep.ZambiaZimbabwe Timeline:
This timeline shows a graph from 1973 to 1999 of Kuwait. No data until 1972. Number of actual observations by date: 23.
Source name:
World Development Indicators
Source organization:
International Monetary Fund, Government Finance Statistics Yearbook and data files.
Categories, topics:
Public Sector
Last updated:
apr 23, 2017
Indicators value changes by year
Minimum:
1000.0K
jan 1, 1991
Maximum:
300.0 mln
jan 1, 1975
At the date of observation
Value
Absolute change
Change from previous value
jan 1, 1973
121.0 mln
+121.0 mln
0.0%
jan 1, 1974
133.0 mln
+12.0 mln
9.92%
jan 1, 1975
300.0 mln
+167.0 mln
125.56%
jan 1, 1978
37.0 mln
-263.0 mln
-87.67%
jan 1, 1979
21.0 mln
-16.0 mln
-43.24%
jan 1, 1980
23.0 mln
+2.0 mln
9.52%
jan 1, 1981
22.0 mln
-1000.0K
-4.35%
jan 1, 1982
38.0 mln
+16.0 mln
72.73%
jan 1, 1983
36.0 mln
-2.0 mln
-5.26%
jan 1, 1984
25.0 mln
-11.0 mln
-30.56%
jan 1, 1985
46.0 mln
+21.0 mln
84.0%
jan 1, 1986
29.0 mln
-17.0 mln
-36.96%
jan 1, 1987
20.0 mln
-9.0 mln
-31.03%
jan 1, 1988
2.0 mln
-18.0 mln
-90.0%
jan 1, 1989
2.0 mln
0.0
0.0%
jan 1, 1990
3.0 mln
+1000.0K
50.0%
jan 1, 1991
1000.0K
-2.0 mln
-66.67%
jan 1, 1993
1000.0K
0.0
0.0%
jan 1, 1994
1000.0K
0.0
0.0%
jan 1, 1995
1000.0K
0.0
0.0%
jan 1, 1996
1000.0K
0.0
0.0%
jan 1, 1998
1000.0K
0.0
0.0%
jan 1, 1999
1000.0K
0.0
0.0%
Ranking of countries by current statistics by years


Comments: