29
/
en
AIzaSyAYiBZKx7MnpbEhh9jyipgxe19OcubqV5w
April 1, 2024
188540
Malaysia
MYS
true
2
1
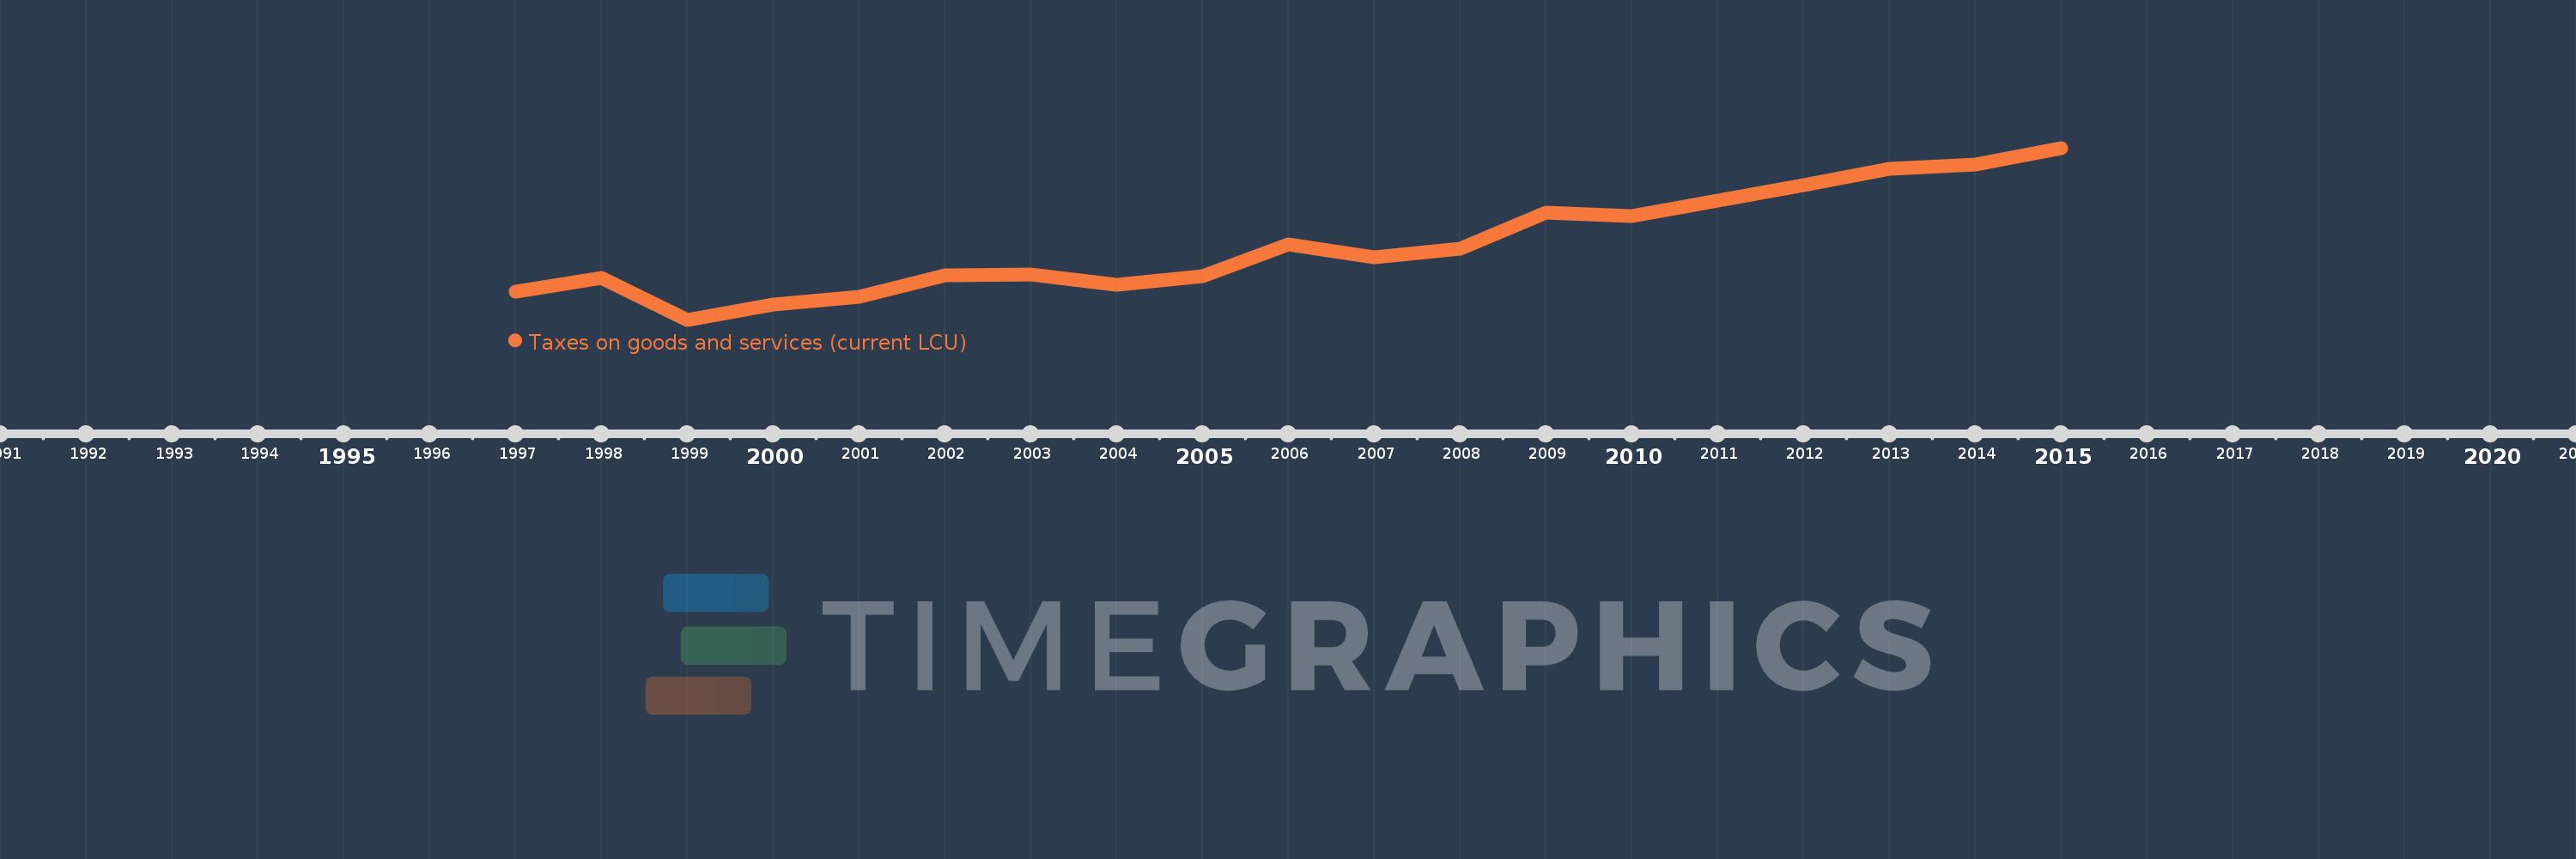
Taxes on goods and services (current LCU)
2015,2014,2013,2012,2011,2010,2009,2008,2007,2006,2005,2004,2003,2002,2001,2000,1999,1998,1997
This statistics in other country:
AfghanistanAlbaniaAlgeriaAngolaAntigua and BarbudaArgentinaArmeniaAustraliaAustriaAzerbaijanBahamas, TheBahrainBangladeshBarbadosBelarusBelgiumBelizeBeninBhutanBoliviaBosnia and HerzegovinaBotswanaBrazilBulgariaBurkina FasoBurundiCabo VerdeCambodiaCanadaCentral African RepublicChileChinaColombiaCongo, Dem. Rep.Congo, Rep.Costa RicaCote d'IvoireCroatiaCyprusCzech RepublicDenmarkDominicaDominican RepublicEgypt, Arab Rep.El SalvadorEquatorial GuineaEstoniaEthiopiaFijiFinlandFranceGambia, TheGeorgiaGermanyGhanaGreeceGrenadaGuatemalaHondurasHong Kong SAR, ChinaHungaryIcelandIndiaIndonesiaIran, Islamic Rep.IraqIrelandIsraelItalyJamaicaJapanJordanKazakhstanKenyaKiribatiKorea, Rep.KuwaitKyrgyz RepublicLao PDRLatviaLebanonLesothoLiberiaLithuaniaLuxembourgMacao SAR, ChinaMacedonia, FYRMadagascarMalawiMalaysiaMaldivesMaliMaltaMauritiusMexicoMicronesia, Fed. Sts.MoldovaMongoliaMoroccoMozambiqueMyanmarNamibiaNepalNetherlandsNew ZealandNicaraguaNigeriaNorwayOmanPakistanPanamaPapua New GuineaParaguayPeruPhilippinesPolandPortugalRomaniaRussian FederationRwandaSamoaSan MarinoSao Tome and PrincipeSenegalSerbiaSeychellesSierra LeoneSingaporeSlovak RepublicSloveniaSolomon IslandsSouth AfricaSpainSri LankaSt. Kitts and NevisSt. LuciaSurinameSwazilandSwedenSwitzerlandSyrian Arab RepublicTajikistanTanzaniaThailandTimor-LesteTogoTrinidad and TobagoTunisiaTurkeyUgandaUkraineUnited Arab EmiratesUnited KingdomUnited StatesUruguayVanuatuVenezuela, RBVietnamWest Bank and GazaYemen, Rep.ZambiaZimbabwe Timeline:
This timeline shows a graph from 1997 to 2015 of Malaysia. No data until 1996. Number of actual observations by date: 19.
Source name:
World Development Indicators
Source organization:
International Monetary Fund, Government Finance Statistics Yearbook and data files.
Categories, topics:
Public Sector
Last updated:
apr 23, 2017
Indicators value changes by year
Minimum:
12.716 bln
jan 1, 1999
Maximum:
32.9 bln
jan 1, 2015
At the date of observation
Value
Absolute change
Change from previous value
jan 1, 1997
15.966 bln
+15.966 bln
0.0%
jan 1, 1998
17.607 bln
+1.641 bln
10.28%
jan 1, 1999
12.716 bln
-4.891 bln
-27.78%
jan 1, 2000
14.525 bln
+1.809 bln
14.23%
jan 1, 2001
15.449 bln
+923.2 mln
6.36%
jan 1, 2002
17.919 bln
+2.47 bln
15.99%
jan 1, 2003
18.038 bln
+119.459 mln
0.67%
jan 1, 2004
16.8 bln
-1.238 bln
-6.86%
jan 1, 2005
17.873 bln
+1.073 bln
6.39%
jan 1, 2006
21.58 bln
+3.707 bln
20.74%
jan 1, 2007
20.018 bln
-1.562 bln
-7.24%
jan 1, 2008
21.026 bln
+1.007 bln
5.03%
jan 1, 2009
25.345 bln
+4.32 bln
20.55%
jan 1, 2010
24.863 bln
-482.87 mln
-1.91%
jan 1, 2011
26.73 bln
+1.868 bln
7.51%
jan 1, 2012
28.536 bln
+1.806 bln
6.76%
jan 1, 2013
30.456 bln
+1.92 bln
6.73%
jan 1, 2014
30.975 bln
+518.9 mln
1.7%
jan 1, 2015
32.9 bln
+1.925 bln
6.21%
Ranking of countries by current statistics by years


Comments: