29
/
en
AIzaSyAYiBZKx7MnpbEhh9jyipgxe19OcubqV5w
April 1, 2024
190976
Mali
MLI
true
2
1
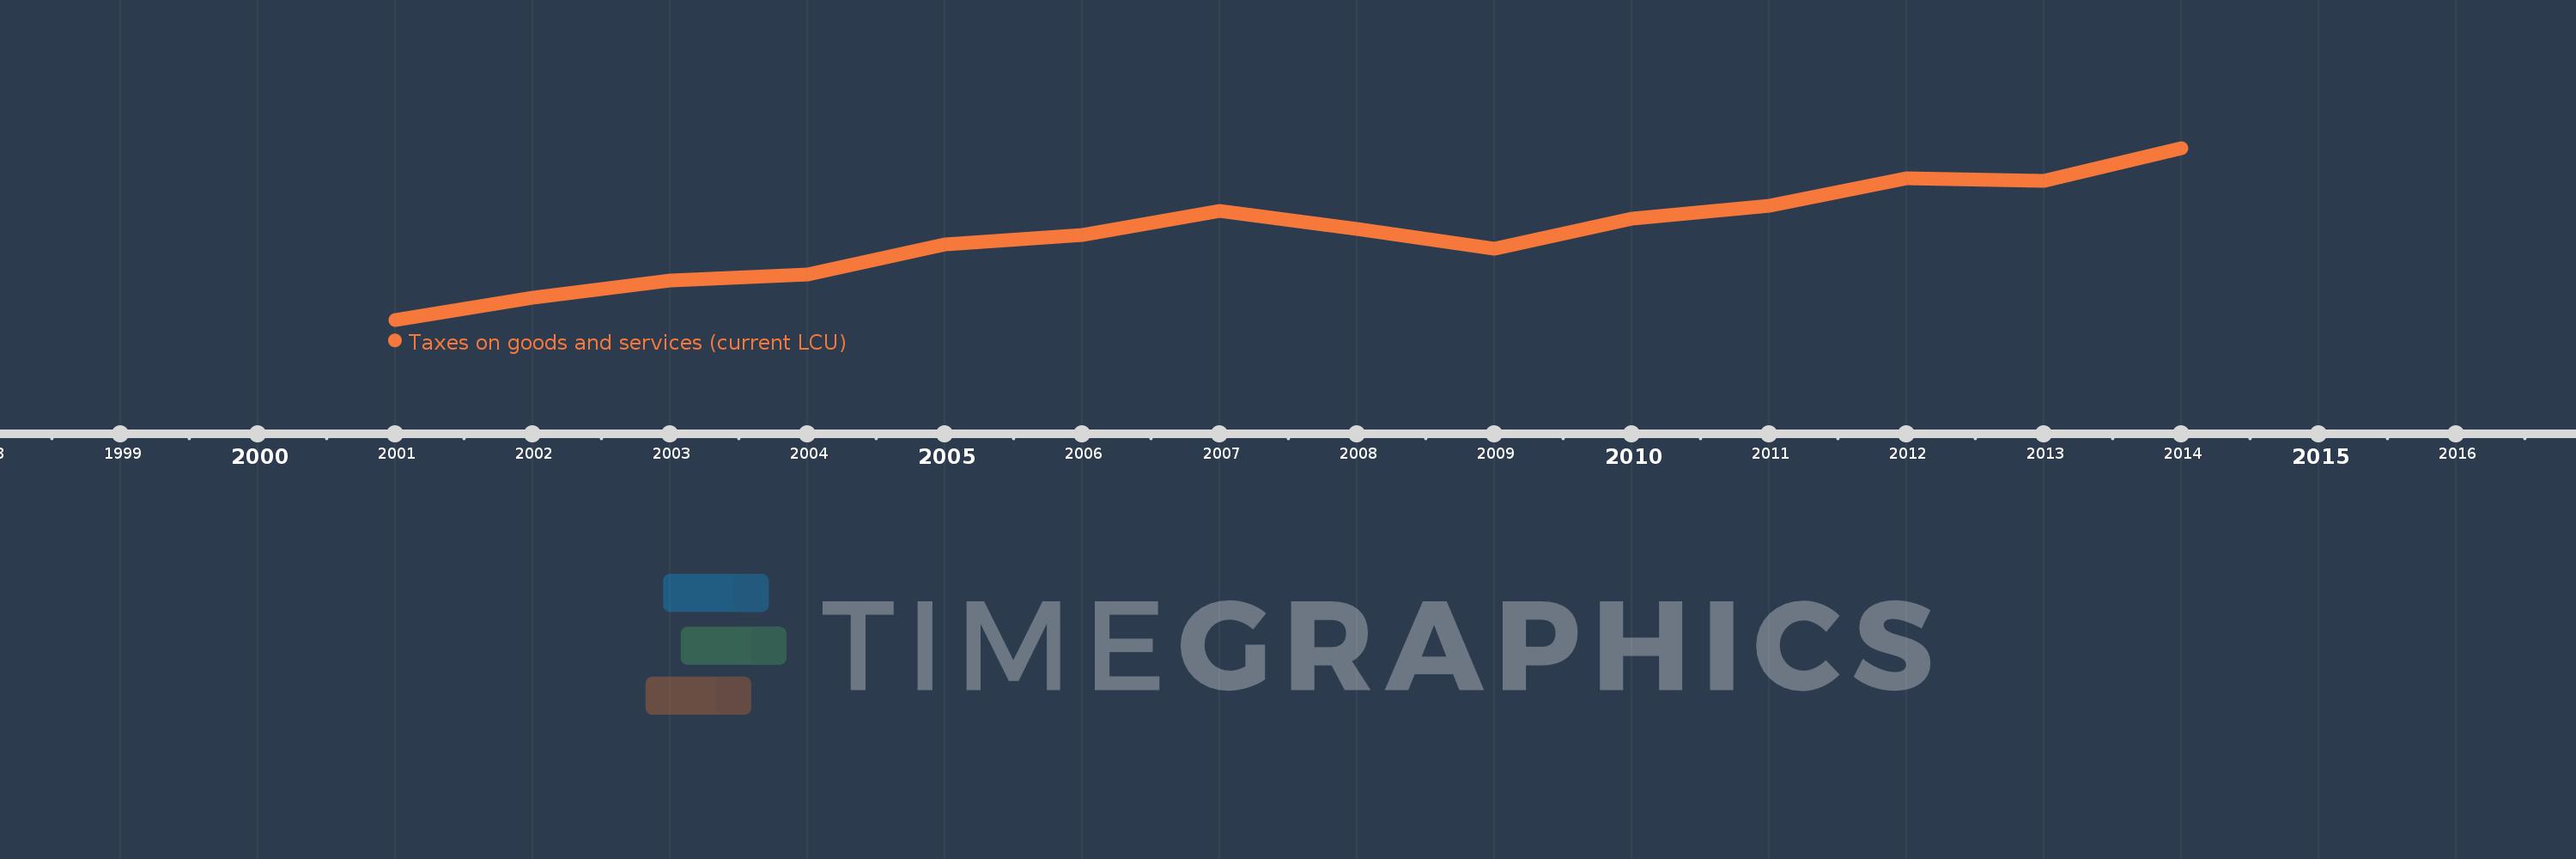
Taxes on goods and services (current LCU)
2014,2013,2012,2011,2010,2009,2008,2007,2006,2005,2004,2003,2002,2001
This statistics in other country:
AfghanistanAlbaniaAlgeriaAngolaAntigua and BarbudaArgentinaArmeniaAustraliaAustriaAzerbaijanBahamas, TheBahrainBangladeshBarbadosBelarusBelgiumBelizeBeninBhutanBoliviaBosnia and HerzegovinaBotswanaBrazilBulgariaBurkina FasoBurundiCabo VerdeCambodiaCanadaCentral African RepublicChileChinaColombiaCongo, Dem. Rep.Congo, Rep.Costa RicaCote d'IvoireCroatiaCyprusCzech RepublicDenmarkDominicaDominican RepublicEgypt, Arab Rep.El SalvadorEquatorial GuineaEstoniaEthiopiaFijiFinlandFranceGambia, TheGeorgiaGermanyGhanaGreeceGrenadaGuatemalaHondurasHong Kong SAR, ChinaHungaryIcelandIndiaIndonesiaIran, Islamic Rep.IraqIrelandIsraelItalyJamaicaJapanJordanKazakhstanKenyaKiribatiKorea, Rep.KuwaitKyrgyz RepublicLao PDRLatviaLebanonLesothoLiberiaLithuaniaLuxembourgMacao SAR, ChinaMacedonia, FYRMadagascarMalawiMalaysiaMaldivesMaliMaltaMauritiusMexicoMicronesia, Fed. Sts.MoldovaMongoliaMoroccoMozambiqueMyanmarNamibiaNepalNetherlandsNew ZealandNicaraguaNigeriaNorwayOmanPakistanPanamaPapua New GuineaParaguayPeruPhilippinesPolandPortugalRomaniaRussian FederationRwandaSamoaSan MarinoSao Tome and PrincipeSenegalSerbiaSeychellesSierra LeoneSingaporeSlovak RepublicSloveniaSolomon IslandsSouth AfricaSpainSri LankaSt. Kitts and NevisSt. LuciaSurinameSwazilandSwedenSwitzerlandSyrian Arab RepublicTajikistanTanzaniaThailandTimor-LesteTogoTrinidad and TobagoTunisiaTurkeyUgandaUkraineUnited Arab EmiratesUnited KingdomUnited StatesUruguayVanuatuVenezuela, RBVietnamWest Bank and GazaYemen, Rep.ZambiaZimbabwe Timeline:
This timeline shows a graph from 2001 to 2014 of Mali. No data until 2000. Number of actual observations by date: 14.
Source name:
World Development Indicators
Source organization:
International Monetary Fund, Government Finance Statistics Yearbook and data files.
Categories, topics:
Public Sector
Last updated:
apr 23, 2017
Indicators value changes by year
Minimum:
139.576 bln
jan 1, 2001
Maximum:
353.185 bln
jan 1, 2014
At the date of observation
Value
Absolute change
Change from previous value
jan 1, 2001
139.576 bln
+139.576 bln
0.0%
jan 1, 2002
166.712 bln
+27.136 bln
19.44%
jan 1, 2003
187.949 bln
+21.237 bln
12.74%
jan 1, 2004
196.201 bln
+8.252 bln
4.39%
jan 1, 2005
233.017 bln
+36.815 bln
18.76%
jan 1, 2006
244.672 bln
+11.656 bln
5.0%
jan 1, 2007
274.629 bln
+29.957 bln
12.24%
jan 1, 2008
252.2 bln
-22.429 bln
-8.17%
jan 1, 2009
227.896 bln
-24.304 bln
-9.64%
jan 1, 2010
265.713 bln
+37.817 bln
16.59%
jan 1, 2011
281.61 bln
+15.897 bln
5.98%
jan 1, 2012
315.11 bln
+33.5 bln
11.9%
jan 1, 2013
312.085 bln
-3.025 bln
-0.96%
jan 1, 2014
353.185 bln
+41.1 bln
13.17%
Ranking of countries by current statistics by years


Comments: