29
/
en
AIzaSyAYiBZKx7MnpbEhh9jyipgxe19OcubqV5w
April 1, 2024
138814
Georgia
GEO
true
2
1
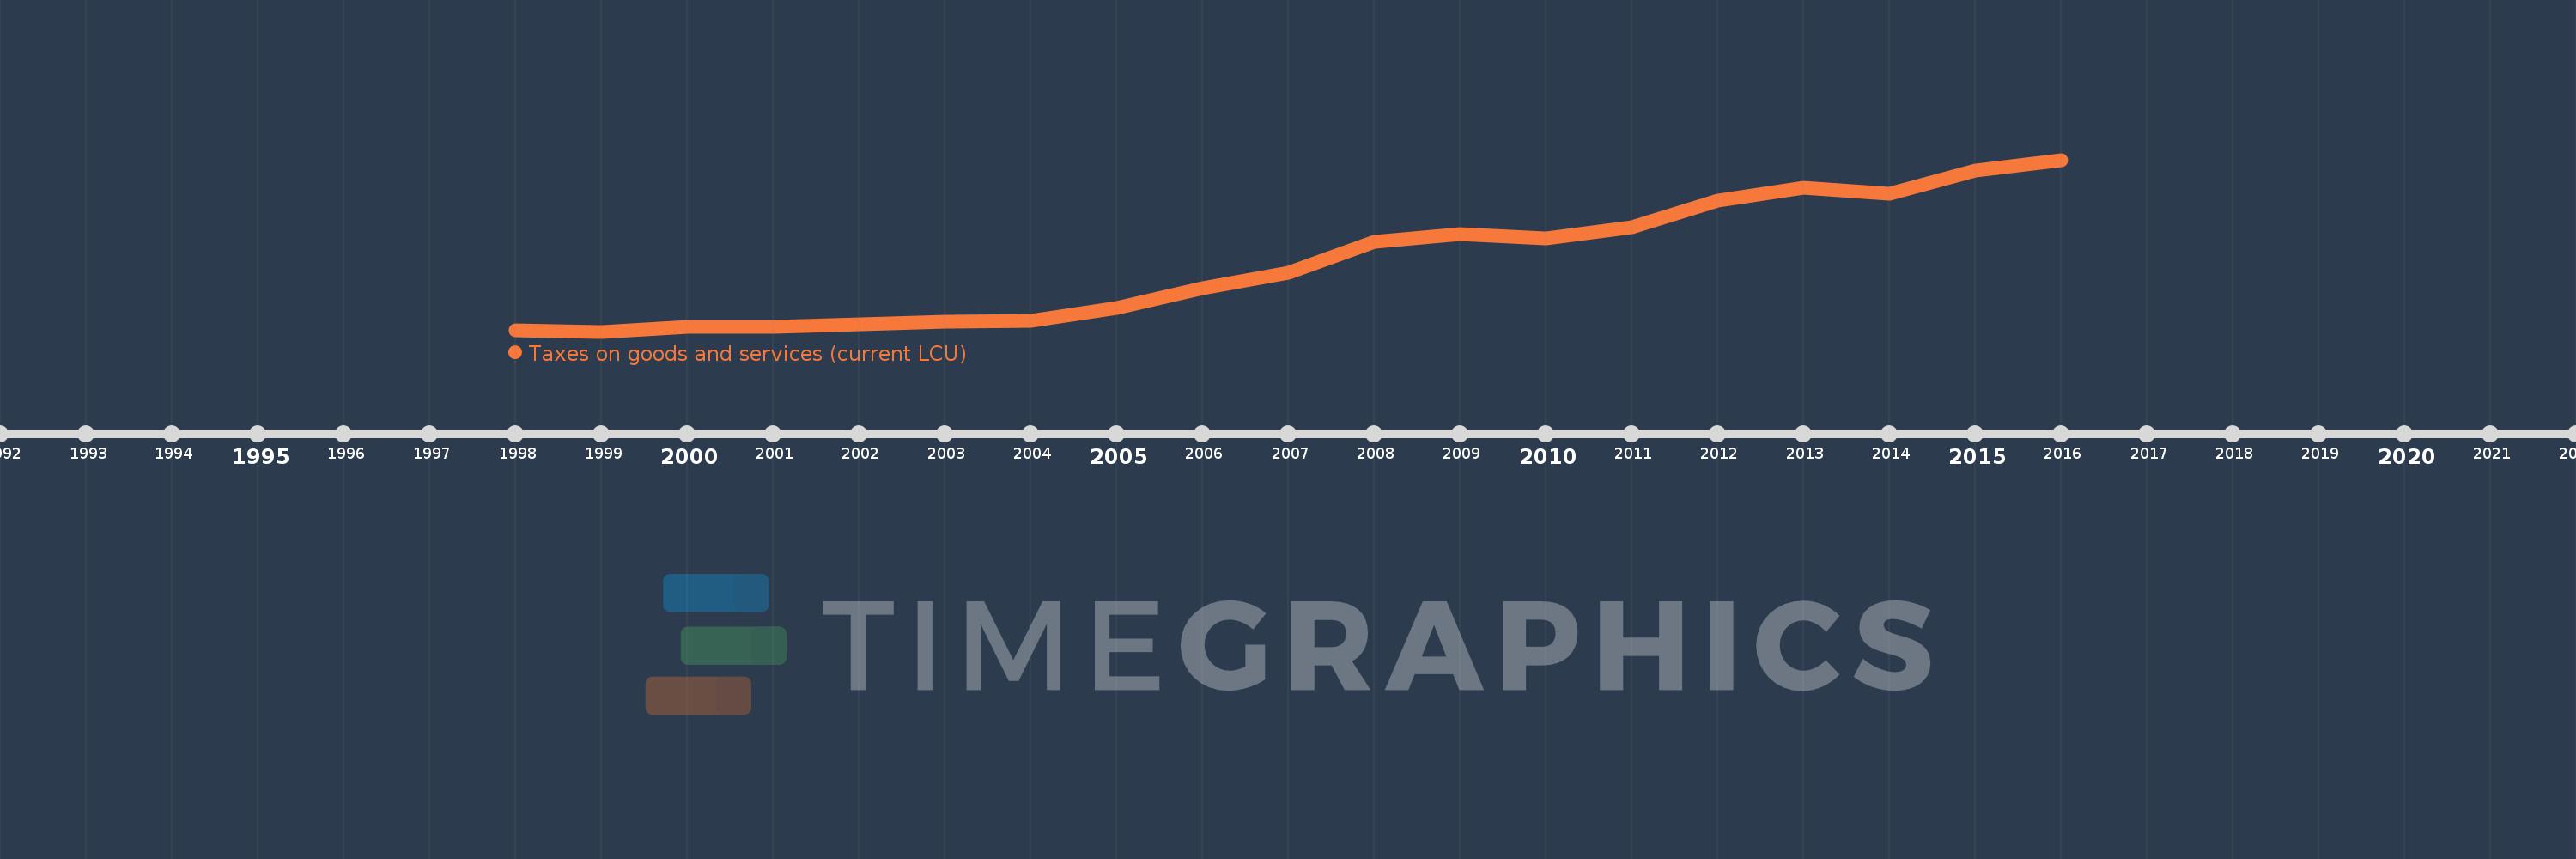
Taxes on goods and services (current LCU)
2016,2015,2014,2013,2012,2011,2010,2009,2008,2007,2006,2005,2004,2003,2002,2001,2000,1999,1998
This statistics in other country:
AfghanistanAlbaniaAlgeriaAngolaAntigua and BarbudaArgentinaArmeniaAustraliaAustriaAzerbaijanBahamas, TheBahrainBangladeshBarbadosBelarusBelgiumBelizeBeninBhutanBoliviaBosnia and HerzegovinaBotswanaBrazilBulgariaBurkina FasoBurundiCabo VerdeCambodiaCanadaCentral African RepublicChileChinaColombiaCongo, Dem. Rep.Congo, Rep.Costa RicaCote d'IvoireCroatiaCyprusCzech RepublicDenmarkDominicaDominican RepublicEgypt, Arab Rep.El SalvadorEquatorial GuineaEstoniaEthiopiaFijiFinlandFranceGambia, TheGeorgiaGermanyGhanaGreeceGrenadaGuatemalaHondurasHong Kong SAR, ChinaHungaryIcelandIndiaIndonesiaIran, Islamic Rep.IraqIrelandIsraelItalyJamaicaJapanJordanKazakhstanKenyaKiribatiKorea, Rep.KuwaitKyrgyz RepublicLao PDRLatviaLebanonLesothoLiberiaLithuaniaLuxembourgMacao SAR, ChinaMacedonia, FYRMadagascarMalawiMalaysiaMaldivesMaliMaltaMauritiusMexicoMicronesia, Fed. Sts.MoldovaMongoliaMoroccoMozambiqueMyanmarNamibiaNepalNetherlandsNew ZealandNicaraguaNigeriaNorwayOmanPakistanPanamaPapua New GuineaParaguayPeruPhilippinesPolandPortugalRomaniaRussian FederationRwandaSamoaSan MarinoSao Tome and PrincipeSenegalSerbiaSeychellesSierra LeoneSingaporeSlovak RepublicSloveniaSolomon IslandsSouth AfricaSpainSri LankaSt. Kitts and NevisSt. LuciaSurinameSwazilandSwedenSwitzerlandSyrian Arab RepublicTajikistanTanzaniaThailandTimor-LesteTogoTrinidad and TobagoTunisiaTurkeyUgandaUkraineUnited Arab EmiratesUnited KingdomUnited StatesUruguayVanuatuVenezuela, RBVietnamWest Bank and GazaYemen, Rep.ZambiaZimbabwe Timeline:
This timeline shows a graph from 1998 to 2016 of Georgia. No data until 1997. Number of actual observations by date: 19.
Source name:
World Development Indicators
Source organization:
International Monetary Fund, Government Finance Statistics Yearbook and data files.
Categories, topics:
Public Sector
Last updated:
apr 23, 2017
Indicators value changes by year
Minimum:
245.9 mln
jan 1, 1999
Maximum:
4.376 bln
jan 1, 2016
At the date of observation
Value
Absolute change
Change from previous value
jan 1, 1998
278.6 mln
+278.6 mln
0.0%
jan 1, 1999
245.9 mln
-32.7 mln
-11.74%
jan 1, 2000
356.9 mln
+111.0 mln
45.14%
jan 1, 2001
366.1 mln
+9.2 mln
2.58%
jan 1, 2002
426.7 mln
+60.6 mln
16.55%
jan 1, 2003
489.2 mln
+62.5 mln
14.65%
jan 1, 2004
504.2 mln
+15.0 mln
3.07%
jan 1, 2005
811.8 mln
+307.6 mln
61.01%
jan 1, 2006
1.282 bln
+470.7 mln
57.98%
jan 1, 2007
1.668 bln
+385.8 mln
30.08%
jan 1, 2008
2.402 bln
+734.0 mln
44.0%
jan 1, 2009
2.587 bln
+185.2 mln
7.71%
jan 1, 2010
2.495 bln
-92.6 mln
-3.58%
jan 1, 2011
2.764 bln
+269.0 mln
10.78%
jan 1, 2012
3.4 bln
+635.6 mln
23.0%
jan 1, 2013
3.7 bln
+300.4 mln
8.84%
jan 1, 2014
3.57 bln
-129.8 mln
-3.51%
jan 1, 2015
4.109 bln
+538.6 mln
15.09%
jan 1, 2016
4.376 bln
+267.5 mln
6.51%
Ranking of countries by current statistics by years


Comments: