29
/
en
AIzaSyAYiBZKx7MnpbEhh9jyipgxe19OcubqV5w
April 1, 2024
145153
Guatemala
GTM
true
2
1
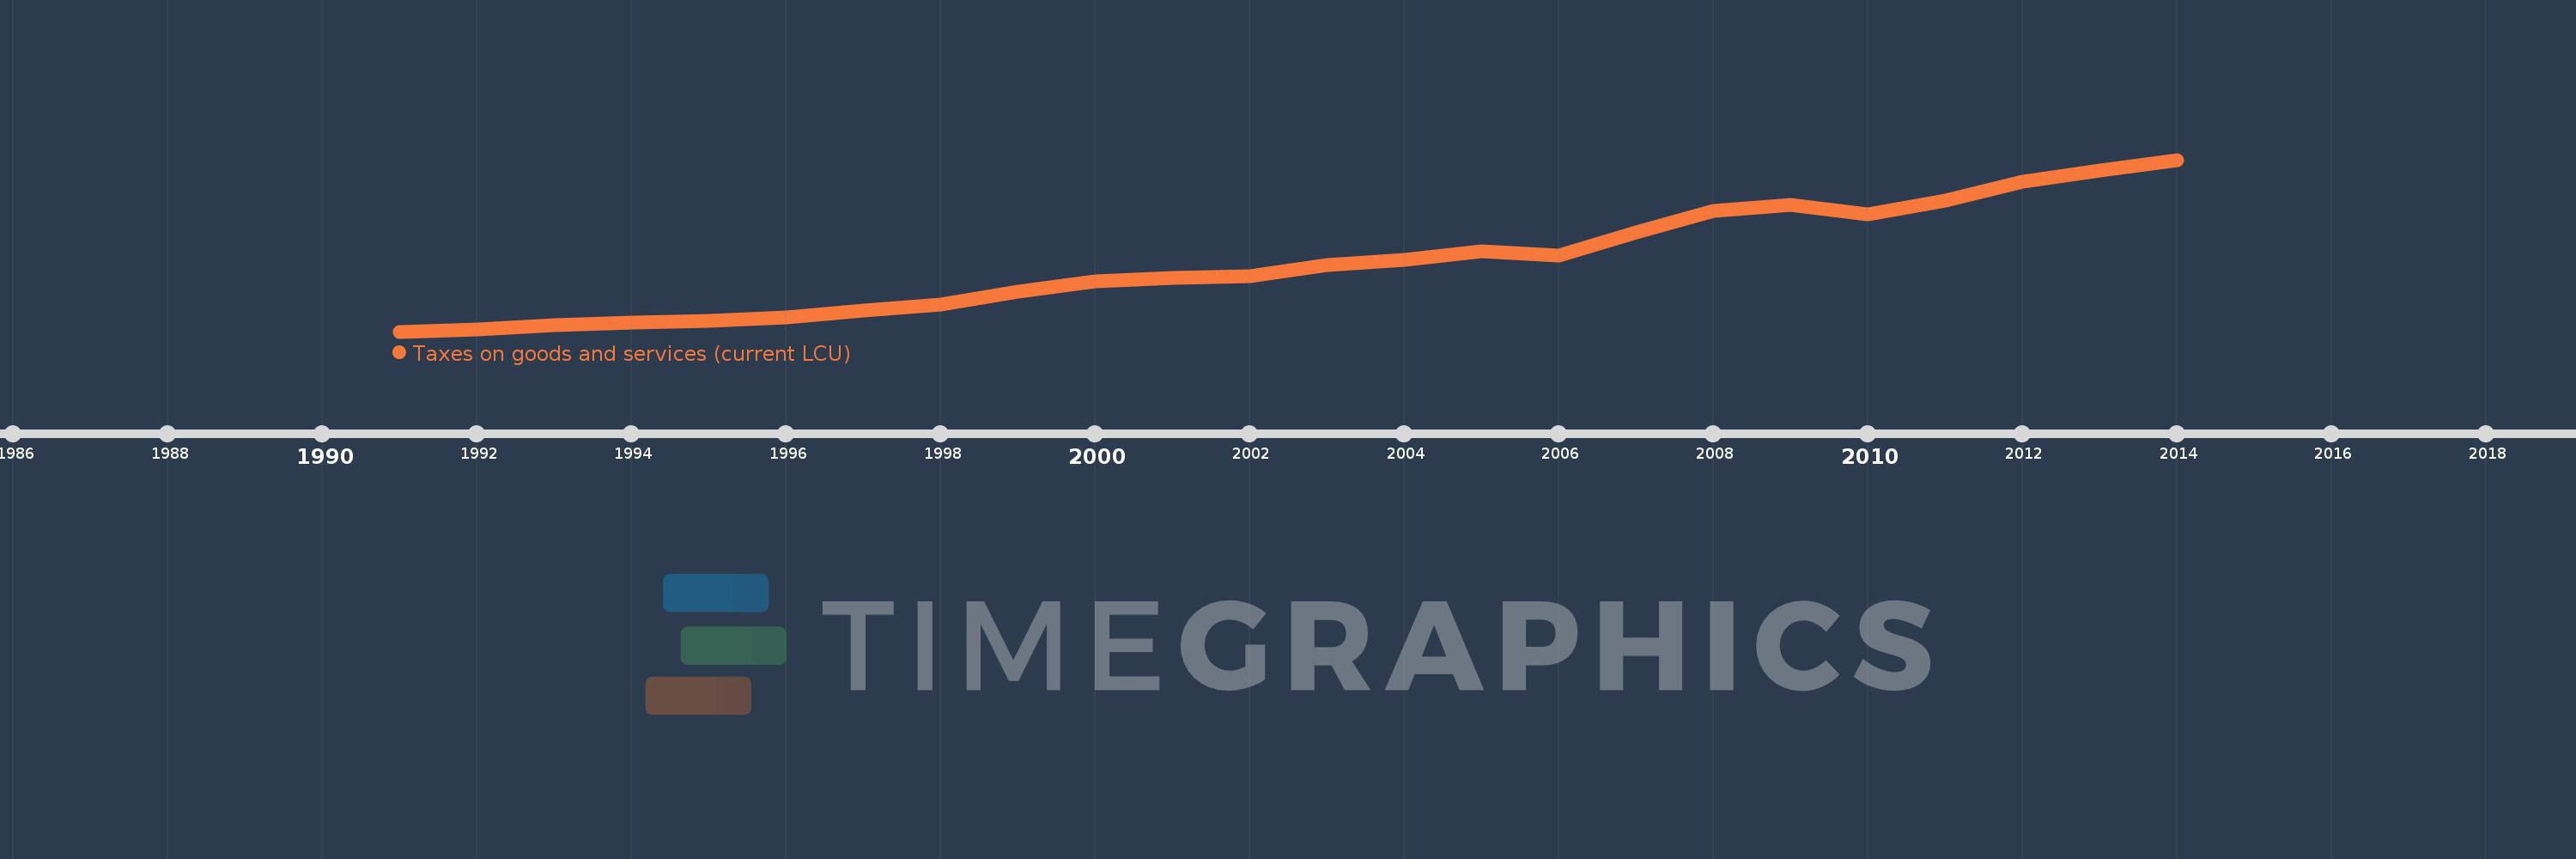
Taxes on goods and services (current LCU)
2014,2013,2012,2011,2010,2009,2008,2007,2006,2005,2004,2003,2002,2001,2000,1999,1998,1997,1996,1995,1994,1993,1992,1991
This statistics in other country:
AfghanistanAlbaniaAlgeriaAngolaAntigua and BarbudaArgentinaArmeniaAustraliaAustriaAzerbaijanBahamas, TheBahrainBangladeshBarbadosBelarusBelgiumBelizeBeninBhutanBoliviaBosnia and HerzegovinaBotswanaBrazilBulgariaBurkina FasoBurundiCabo VerdeCambodiaCanadaCentral African RepublicChileChinaColombiaCongo, Dem. Rep.Congo, Rep.Costa RicaCote d'IvoireCroatiaCyprusCzech RepublicDenmarkDominicaDominican RepublicEgypt, Arab Rep.El SalvadorEquatorial GuineaEstoniaEthiopiaFijiFinlandFranceGambia, TheGeorgiaGermanyGhanaGreeceGrenadaGuatemalaHondurasHong Kong SAR, ChinaHungaryIcelandIndiaIndonesiaIran, Islamic Rep.IraqIrelandIsraelItalyJamaicaJapanJordanKazakhstanKenyaKiribatiKorea, Rep.KuwaitKyrgyz RepublicLao PDRLatviaLebanonLesothoLiberiaLithuaniaLuxembourgMacao SAR, ChinaMacedonia, FYRMadagascarMalawiMalaysiaMaldivesMaliMaltaMauritiusMexicoMicronesia, Fed. Sts.MoldovaMongoliaMoroccoMozambiqueMyanmarNamibiaNepalNetherlandsNew ZealandNicaraguaNigeriaNorwayOmanPakistanPanamaPapua New GuineaParaguayPeruPhilippinesPolandPortugalRomaniaRussian FederationRwandaSamoaSan MarinoSao Tome and PrincipeSenegalSerbiaSeychellesSierra LeoneSingaporeSlovak RepublicSloveniaSolomon IslandsSouth AfricaSpainSri LankaSt. Kitts and NevisSt. LuciaSurinameSwazilandSwedenSwitzerlandSyrian Arab RepublicTajikistanTanzaniaThailandTimor-LesteTogoTrinidad and TobagoTunisiaTurkeyUgandaUkraineUnited Arab EmiratesUnited KingdomUnited StatesUruguayVanuatuVenezuela, RBVietnamWest Bank and GazaYemen, Rep.ZambiaZimbabwe Timeline:
This timeline shows a graph from 1991 to 2014 of Guatemala. No data until 1990. Number of actual observations by date: 24.
Source name:
World Development Indicators
Source organization:
International Monetary Fund, Government Finance Statistics Yearbook and data files.
Categories, topics:
Public Sector
Last updated:
apr 23, 2017
Indicators value changes by year
Minimum:
1.142 bln
jan 1, 1991
Maximum:
27.541 bln
jan 1, 2014
At the date of observation
Value
Absolute change
Change from previous value
jan 1, 1991
1.142 bln
+1.142 bln
0.0%
jan 1, 1992
1.465 bln
+322.63 mln
28.25%
jan 1, 1993
2.12 bln
+655.13 mln
44.73%
jan 1, 1994
2.513 bln
+393.15 mln
18.55%
jan 1, 1995
2.779 bln
+266.37 mln
10.6%
jan 1, 1996
3.308 bln
+528.84 mln
19.03%
jan 1, 1997
4.429 bln
+1.121 bln
33.9%
jan 1, 1998
5.365 bln
+935.73 mln
21.12%
jan 1, 1999
7.312 bln
+1.946 bln
36.28%
jan 1, 2000
8.886 bln
+1.574 bln
21.53%
jan 1, 2001
9.376 bln
+490.43 mln
5.52%
jan 1, 2002
9.679 bln
+303.09 mln
3.23%
jan 1, 2003
11.435 bln
+1.756 bln
18.14%
jan 1, 2004
12.146 bln
+710.9 mln
6.22%
jan 1, 2005
13.536 bln
+1.39 bln
11.44%
jan 1, 2006
12.8 bln
-735.72 mln
-5.44%
jan 1, 2007
16.398 bln
+3.598 bln
28.11%
jan 1, 2008
19.623 bln
+3.225 bln
19.67%
jan 1, 2009
20.61 bln
+986.8 mln
5.03%
jan 1, 2010
19.155 bln
-1.455 bln
-7.06%
jan 1, 2011
21.266 bln
+2.11 bln
11.02%
jan 1, 2012
24.109 bln
+2.844 bln
13.37%
jan 1, 2013
25.901 bln
+1.792 bln
7.43%
jan 1, 2014
27.541 bln
+1.64 bln
6.33%
Ranking of countries by current statistics by years


Comments: