29
/
en
AIzaSyAYiBZKx7MnpbEhh9jyipgxe19OcubqV5w
April 1, 2024
121571
Dominica
DMA
true
2
1
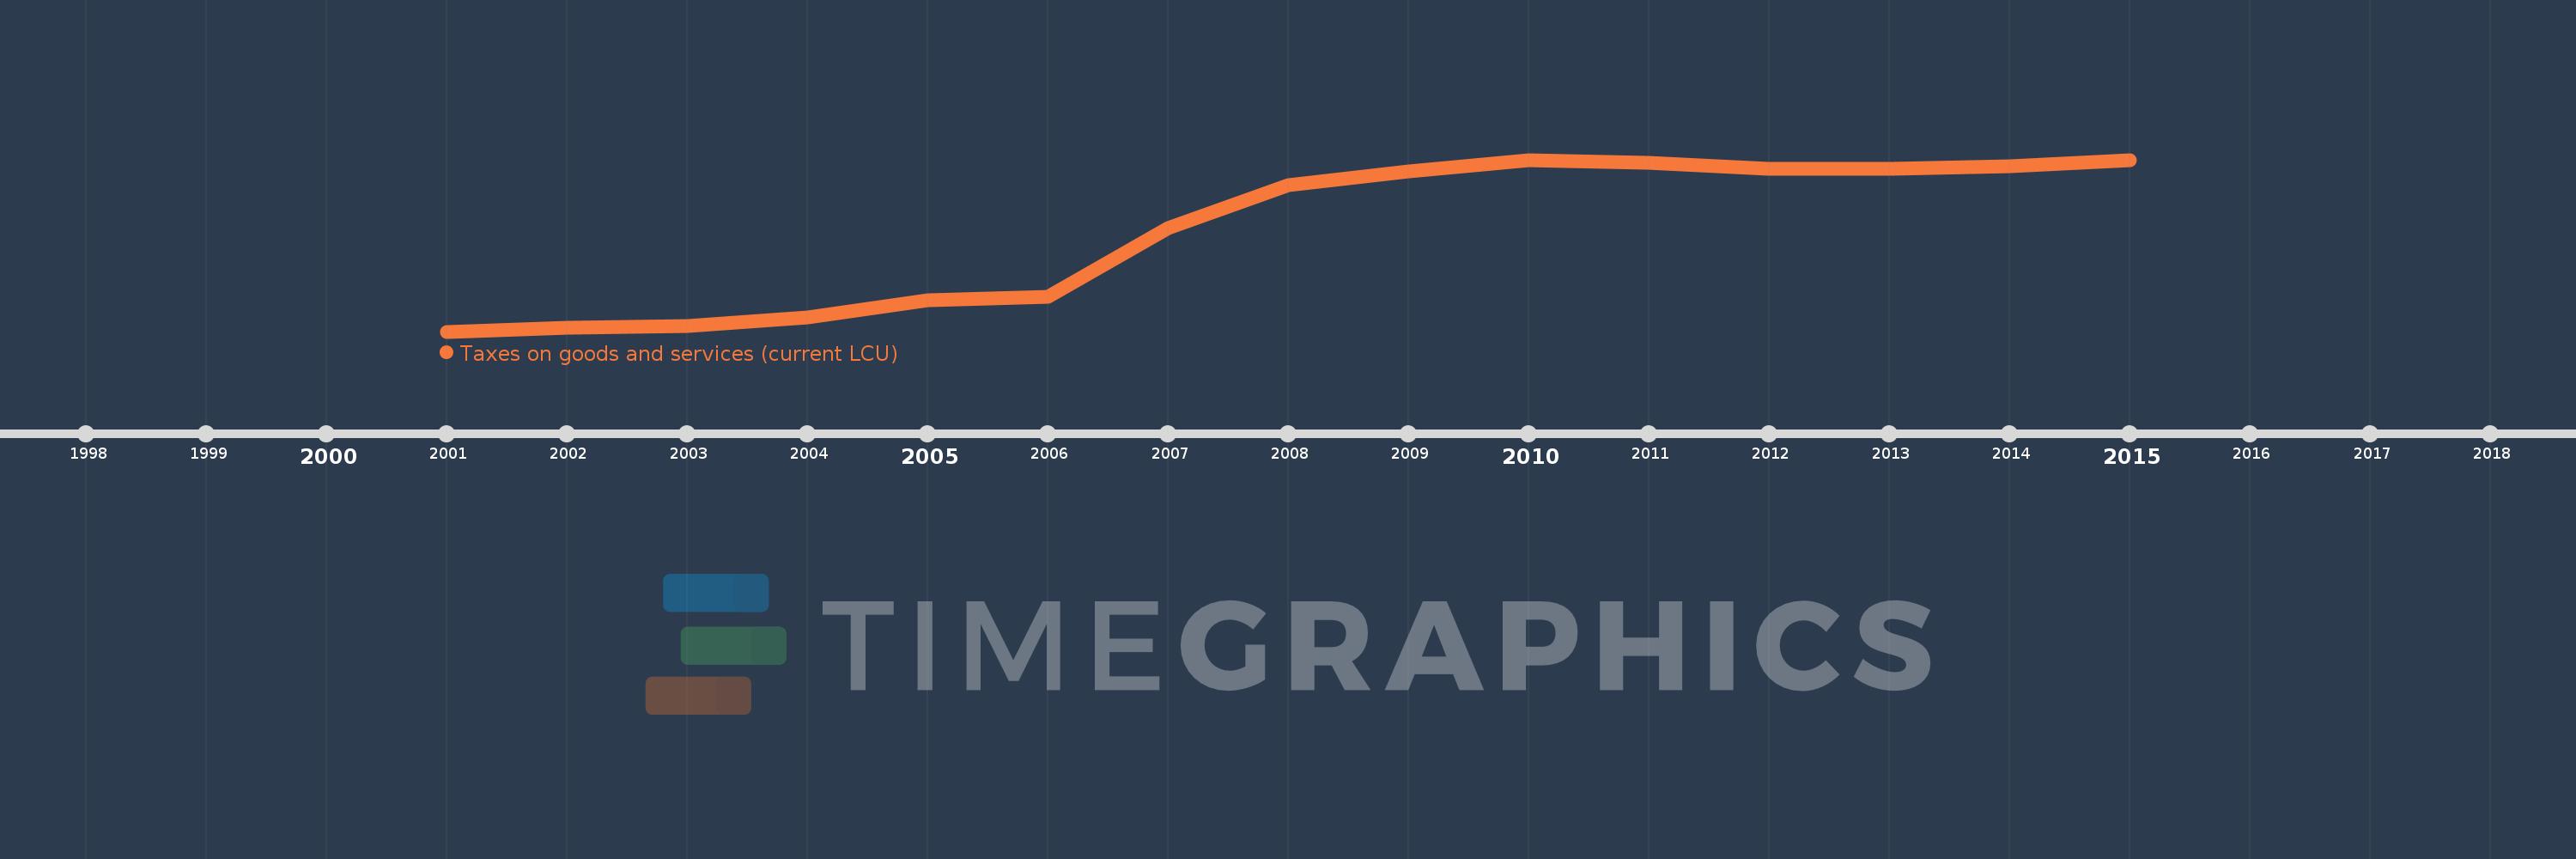
Taxes on goods and services (current LCU)
2015,2014,2013,2012,2011,2010,2009,2008,2007,2006,2005,2004,2003,2002,2001
This statistics in other country:
AfghanistanAlbaniaAlgeriaAngolaAntigua and BarbudaArgentinaArmeniaAustraliaAustriaAzerbaijanBahamas, TheBahrainBangladeshBarbadosBelarusBelgiumBelizeBeninBhutanBoliviaBosnia and HerzegovinaBotswanaBrazilBulgariaBurkina FasoBurundiCabo VerdeCambodiaCanadaCentral African RepublicChileChinaColombiaCongo, Dem. Rep.Congo, Rep.Costa RicaCote d'IvoireCroatiaCyprusCzech RepublicDenmarkDominicaDominican RepublicEgypt, Arab Rep.El SalvadorEquatorial GuineaEstoniaEthiopiaFijiFinlandFranceGambia, TheGeorgiaGermanyGhanaGreeceGrenadaGuatemalaHondurasHong Kong SAR, ChinaHungaryIcelandIndiaIndonesiaIran, Islamic Rep.IraqIrelandIsraelItalyJamaicaJapanJordanKazakhstanKenyaKiribatiKorea, Rep.KuwaitKyrgyz RepublicLao PDRLatviaLebanonLesothoLiberiaLithuaniaLuxembourgMacao SAR, ChinaMacedonia, FYRMadagascarMalawiMalaysiaMaldivesMaliMaltaMauritiusMexicoMicronesia, Fed. Sts.MoldovaMongoliaMoroccoMozambiqueMyanmarNamibiaNepalNetherlandsNew ZealandNicaraguaNigeriaNorwayOmanPakistanPanamaPapua New GuineaParaguayPeruPhilippinesPolandPortugalRomaniaRussian FederationRwandaSamoaSan MarinoSao Tome and PrincipeSenegalSerbiaSeychellesSierra LeoneSingaporeSlovak RepublicSloveniaSolomon IslandsSouth AfricaSpainSri LankaSt. Kitts and NevisSt. LuciaSurinameSwazilandSwedenSwitzerlandSyrian Arab RepublicTajikistanTanzaniaThailandTimor-LesteTogoTrinidad and TobagoTunisiaTurkeyUgandaUkraineUnited Arab EmiratesUnited KingdomUnited StatesUruguayVanuatuVenezuela, RBVietnamWest Bank and GazaYemen, Rep.ZambiaZimbabwe Timeline:
This timeline shows a graph from 2001 to 2015 of Dominica. No data until 2000. Number of actual observations by date: 15.
Source name:
World Development Indicators
Source organization:
International Monetary Fund, Government Finance Statistics Yearbook and data files.
Categories, topics:
Public Sector
Last updated:
apr 23, 2017
Indicators value changes by year
Minimum:
26.9 mln
jan 1, 2001
Maximum:
186.59 mln
jan 1, 2015
At the date of observation
Value
Absolute change
Change from previous value
jan 1, 2001
26.9 mln
+26.9 mln
0.0%
jan 1, 2002
30.3 mln
+3.4 mln
12.64%
jan 1, 2003
32.4 mln
+2.1 mln
6.93%
jan 1, 2004
40.2 mln
+7.8 mln
24.07%
jan 1, 2005
55.9 mln
+15.7 mln
39.05%
jan 1, 2006
59.3 mln
+3.4 mln
6.08%
jan 1, 2007
123.2 mln
+63.9 mln
107.76%
jan 1, 2008
162.7 mln
+39.5 mln
32.06%
jan 1, 2009
176.1 mln
+13.4 mln
8.24%
jan 1, 2010
185.93 mln
+9.83 mln
5.58%
jan 1, 2011
184.027 mln
-1.903 mln
-1.02%
jan 1, 2012
177.931 mln
-6.095 mln
-3.31%
jan 1, 2013
178.096 mln
+164.767K
0.09%
jan 1, 2014
180.219 mln
+2.122 mln
1.19%
jan 1, 2015
186.59 mln
+6.372 mln
3.54%
Ranking of countries by current statistics by years


Comments: