29
/
en
AIzaSyAYiBZKx7MnpbEhh9jyipgxe19OcubqV5w
April 1, 2024
273023
Uganda
UGA
true
2
1
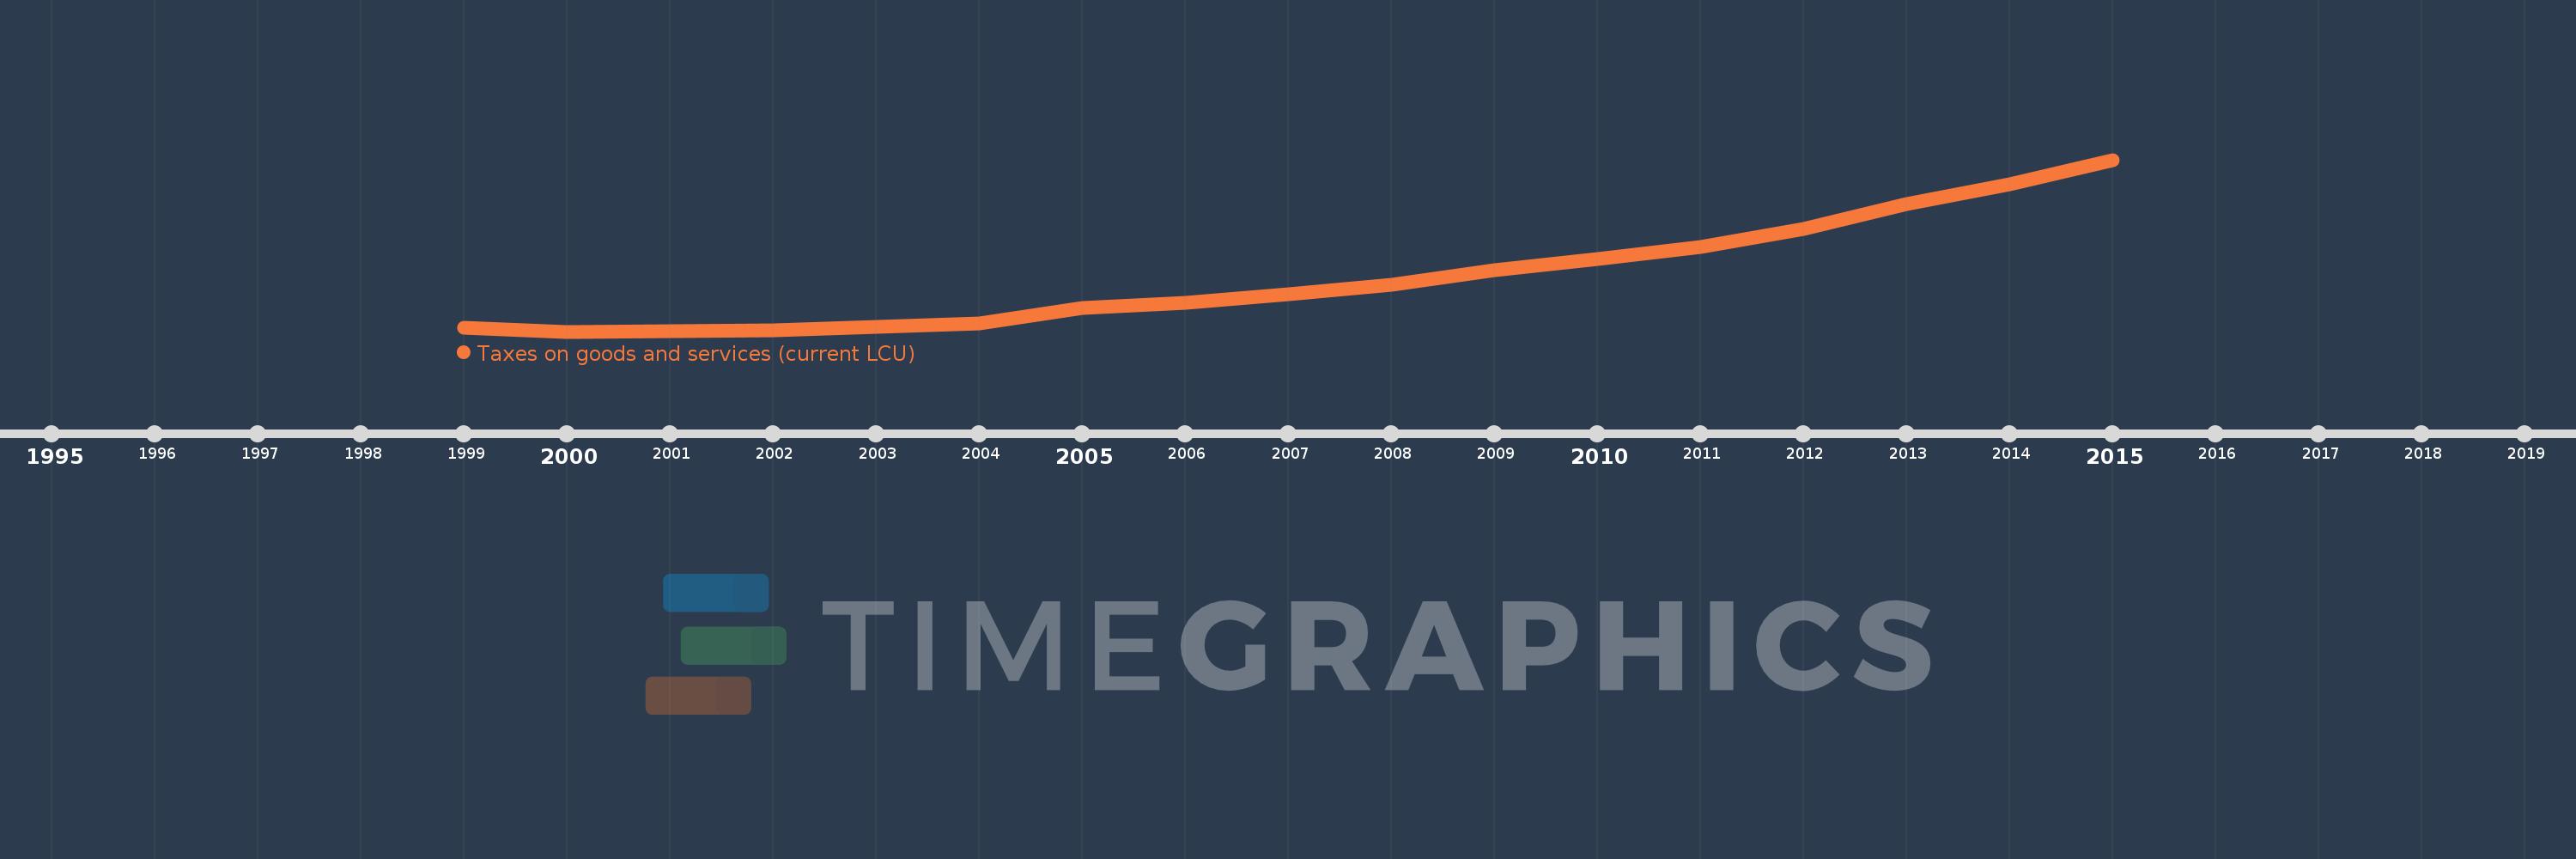
Taxes on goods and services (current LCU)
2015,2014,2013,2012,2011,2010,2009,2008,2007,2006,2005,2004,2003,2002,2001,2000,1999
This statistics in other country:
AfghanistanAlbaniaAlgeriaAngolaAntigua and BarbudaArgentinaArmeniaAustraliaAustriaAzerbaijanBahamas, TheBahrainBangladeshBarbadosBelarusBelgiumBelizeBeninBhutanBoliviaBosnia and HerzegovinaBotswanaBrazilBulgariaBurkina FasoBurundiCabo VerdeCambodiaCanadaCentral African RepublicChileChinaColombiaCongo, Dem. Rep.Congo, Rep.Costa RicaCote d'IvoireCroatiaCyprusCzech RepublicDenmarkDominicaDominican RepublicEgypt, Arab Rep.El SalvadorEquatorial GuineaEstoniaEthiopiaFijiFinlandFranceGambia, TheGeorgiaGermanyGhanaGreeceGrenadaGuatemalaHondurasHong Kong SAR, ChinaHungaryIcelandIndiaIndonesiaIran, Islamic Rep.IraqIrelandIsraelItalyJamaicaJapanJordanKazakhstanKenyaKiribatiKorea, Rep.KuwaitKyrgyz RepublicLao PDRLatviaLebanonLesothoLiberiaLithuaniaLuxembourgMacao SAR, ChinaMacedonia, FYRMadagascarMalawiMalaysiaMaldivesMaliMaltaMauritiusMexicoMicronesia, Fed. Sts.MoldovaMongoliaMoroccoMozambiqueMyanmarNamibiaNepalNetherlandsNew ZealandNicaraguaNigeriaNorwayOmanPakistanPanamaPapua New GuineaParaguayPeruPhilippinesPolandPortugalRomaniaRussian FederationRwandaSamoaSan MarinoSao Tome and PrincipeSenegalSerbiaSeychellesSierra LeoneSingaporeSlovak RepublicSloveniaSolomon IslandsSouth AfricaSpainSri LankaSt. Kitts and NevisSt. LuciaSurinameSwazilandSwedenSwitzerlandSyrian Arab RepublicTajikistanTanzaniaThailandTimor-LesteTogoTrinidad and TobagoTunisiaTurkeyUgandaUkraineUnited Arab EmiratesUnited KingdomUnited StatesUruguayVanuatuVenezuela, RBVietnamWest Bank and GazaYemen, Rep.ZambiaZimbabwe Timeline:
This timeline shows a graph from 1999 to 2015 of Uganda. No data until 1998. Number of actual observations by date: 17.
Source name:
World Development Indicators
Source organization:
International Monetary Fund, Government Finance Statistics Yearbook and data files.
Categories, topics:
Public Sector
Last updated:
apr 23, 2017
Indicators value changes by year
Minimum:
452.065 bln
jan 1, 2000
Maximum:
4.536 trl
jan 1, 2015
At the date of observation
Value
Absolute change
Change from previous value
jan 1, 1999
542.0 bln
+542.0 bln
0.0%
jan 1, 2000
452.065 bln
-89.935 bln
-16.59%
jan 1, 2001
468.972 bln
+16.907 bln
3.74%
jan 1, 2002
492.77 bln
+23.798 bln
5.07%
jan 1, 2003
567.03 bln
+74.26 bln
15.07%
jan 1, 2004
647.508 bln
+80.478 bln
14.19%
jan 1, 2005
1.022 trl
+374.262 bln
57.8%
jan 1, 2006
1.145 trl
+123.725 bln
12.11%
jan 1, 2007
1.343 trl
+197.348 bln
17.23%
jan 1, 2008
1.569 trl
+226.142 bln
16.84%
jan 1, 2009
1.915 trl
+346.187 bln
22.06%
jan 1, 2010
2.187 trl
+271.458 bln
14.17%
jan 1, 2011
2.455 trl
+268.842 bln
12.29%
jan 1, 2012
2.882 trl
+426.412 bln
17.37%
jan 1, 2013
3.492 trl
+610.158 bln
21.17%
jan 1, 2014
3.959 trl
+467.028 bln
13.37%
jan 1, 2015
4.536 trl
+576.62 bln
14.56%
Ranking of countries by current statistics by years


Comments: