29
/
en
AIzaSyAYiBZKx7MnpbEhh9jyipgxe19OcubqV5w
April 1, 2024
114354
Cote d'Ivoire
CIV
true
2
1
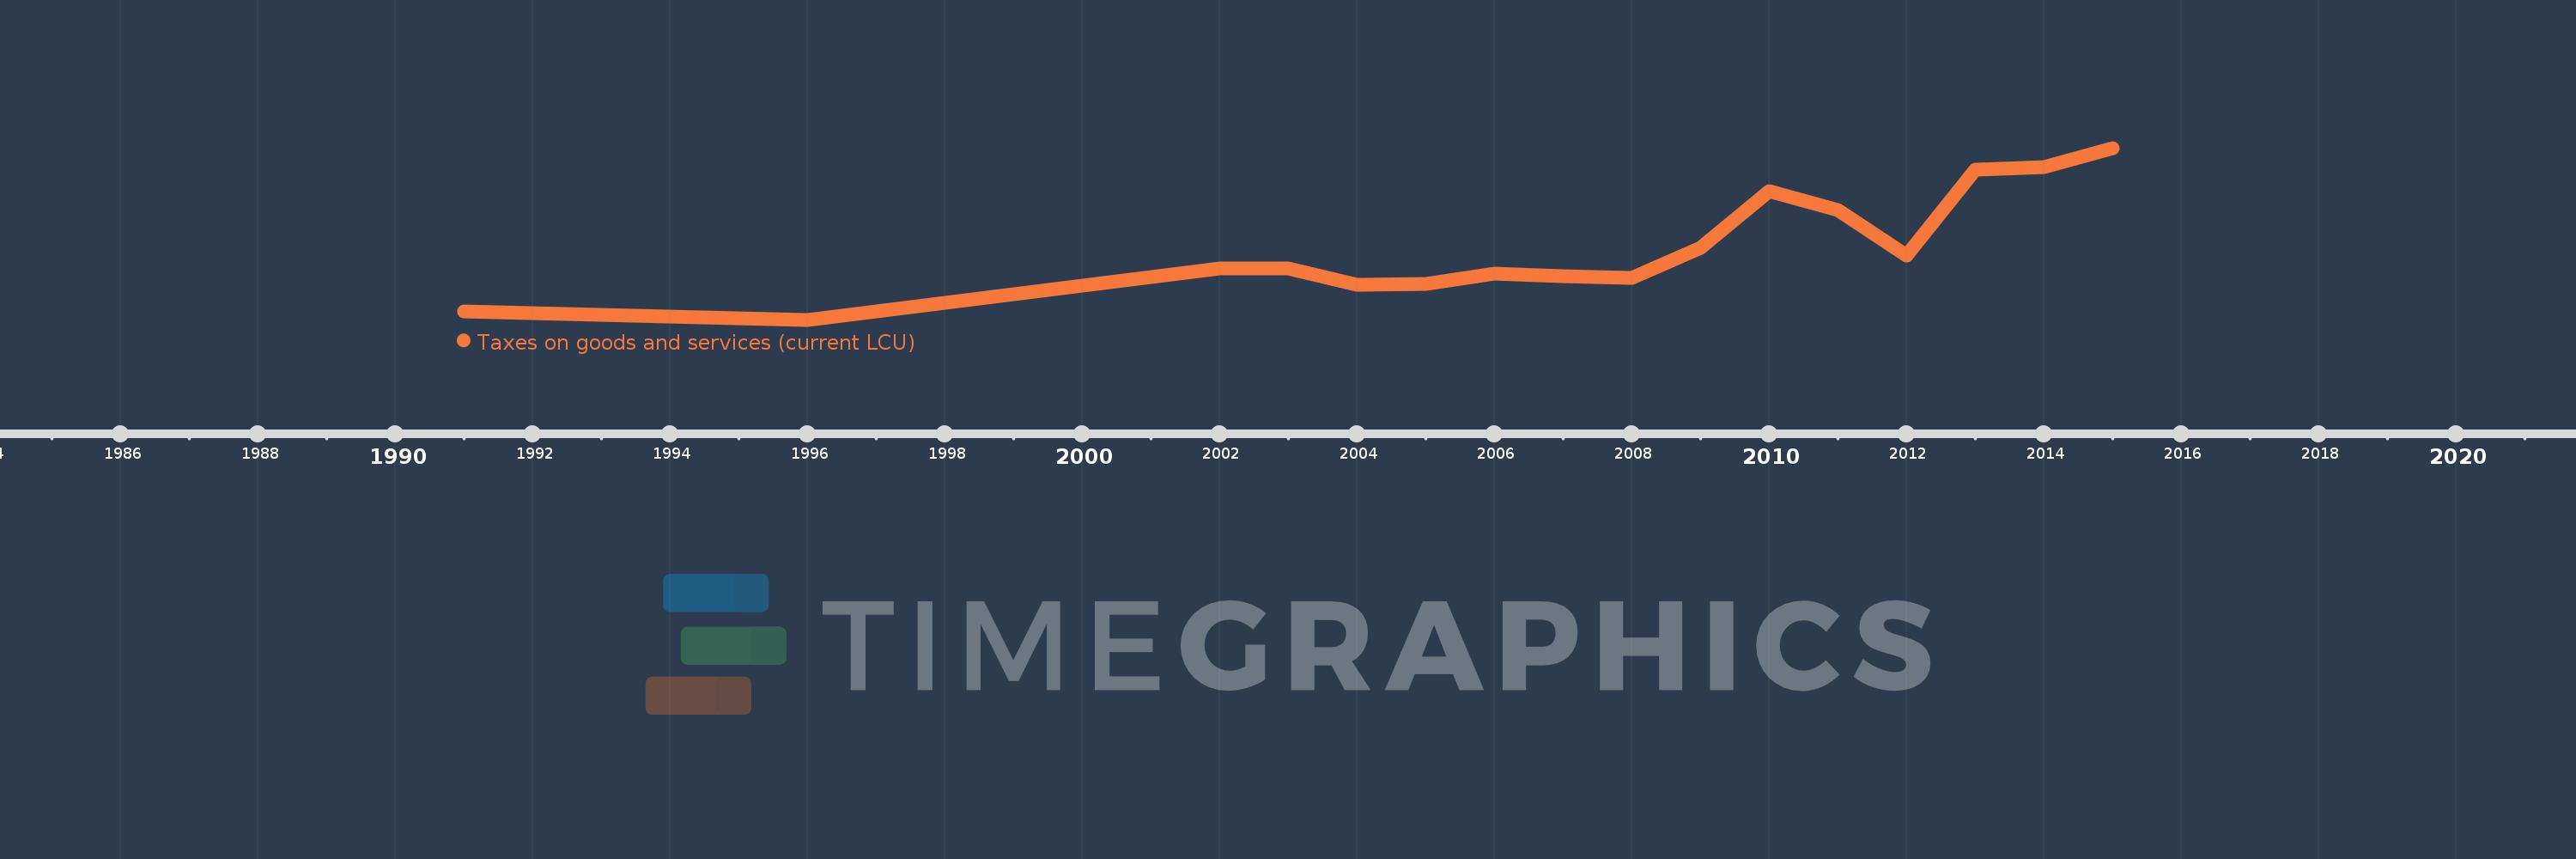
Taxes on goods and services (current LCU)
2015,2014,2013,2012,2011,2010,2009,2008,2007,2006,2005,2004,2003,2002,1996,1991
This statistics in other country:
AfghanistanAlbaniaAlgeriaAngolaAntigua and BarbudaArgentinaArmeniaAustraliaAustriaAzerbaijanBahamas, TheBahrainBangladeshBarbadosBelarusBelgiumBelizeBeninBhutanBoliviaBosnia and HerzegovinaBotswanaBrazilBulgariaBurkina FasoBurundiCabo VerdeCambodiaCanadaCentral African RepublicChileChinaColombiaCongo, Dem. Rep.Congo, Rep.Costa RicaCote d'IvoireCroatiaCyprusCzech RepublicDenmarkDominicaDominican RepublicEgypt, Arab Rep.El SalvadorEquatorial GuineaEstoniaEthiopiaFijiFinlandFranceGambia, TheGeorgiaGermanyGhanaGreeceGrenadaGuatemalaHondurasHong Kong SAR, ChinaHungaryIcelandIndiaIndonesiaIran, Islamic Rep.IraqIrelandIsraelItalyJamaicaJapanJordanKazakhstanKenyaKiribatiKorea, Rep.KuwaitKyrgyz RepublicLao PDRLatviaLebanonLesothoLiberiaLithuaniaLuxembourgMacao SAR, ChinaMacedonia, FYRMadagascarMalawiMalaysiaMaldivesMaliMaltaMauritiusMexicoMicronesia, Fed. Sts.MoldovaMongoliaMoroccoMozambiqueMyanmarNamibiaNepalNetherlandsNew ZealandNicaraguaNigeriaNorwayOmanPakistanPanamaPapua New GuineaParaguayPeruPhilippinesPolandPortugalRomaniaRussian FederationRwandaSamoaSan MarinoSao Tome and PrincipeSenegalSerbiaSeychellesSierra LeoneSingaporeSlovak RepublicSloveniaSolomon IslandsSouth AfricaSpainSri LankaSt. Kitts and NevisSt. LuciaSurinameSwazilandSwedenSwitzerlandSyrian Arab RepublicTajikistanTanzaniaThailandTimor-LesteTogoTrinidad and TobagoTunisiaTurkeyUgandaUkraineUnited Arab EmiratesUnited KingdomUnited StatesUruguayVanuatuVenezuela, RBVietnamWest Bank and GazaYemen, Rep.ZambiaZimbabwe Timeline:
This timeline shows a graph from 1991 to 2015 of Cote d'Ivoire. No data until 1990. Number of actual observations by date: 16.
Source name:
World Development Indicators
Source organization:
International Monetary Fund, Government Finance Statistics Yearbook and data files.
Categories, topics:
Public Sector
Last updated:
apr 23, 2017
Indicators value changes by year
Minimum:
163.7 bln
jan 1, 1996
Maximum:
605.494 bln
jan 1, 2015
At the date of observation
Value
Absolute change
Change from previous value
jan 1, 1991
186.034 bln
+186.034 bln
0.0%
jan 1, 1996
163.7 bln
-22.334 bln
-12.01%
jan 1, 2002
295.5 bln
+131.8 bln
80.51%
jan 1, 2003
296.4 bln
+900.0 mln
0.3%
jan 1, 2004
254.1 bln
-42.3 bln
-14.27%
jan 1, 2005
255.9 bln
+1.8 bln
0.71%
jan 1, 2006
282.4 bln
+26.5 bln
10.36%
jan 1, 2007
275.0 bln
-7.4 bln
-2.62%
jan 1, 2008
270.8 bln
-4.2 bln
-1.53%
jan 1, 2009
348.46 bln
+77.66 bln
28.68%
jan 1, 2010
494.228 bln
+145.768 bln
41.83%
jan 1, 2011
444.782 bln
-49.446 bln
-10.0%
jan 1, 2012
329.545 bln
-115.237 bln
-25.91%
jan 1, 2013
549.899 bln
+220.354 bln
66.87%
jan 1, 2014
556.858 bln
+6.959 bln
1.27%
jan 1, 2015
605.494 bln
+48.636 bln
8.73%
Ranking of countries by current statistics by years


Comments: