29
/pt/
pt
AIzaSyAYiBZKx7MnpbEhh9jyipgxe19OcubqV5w
April 1, 2024
96791
Burundi
BDI
true
2
1
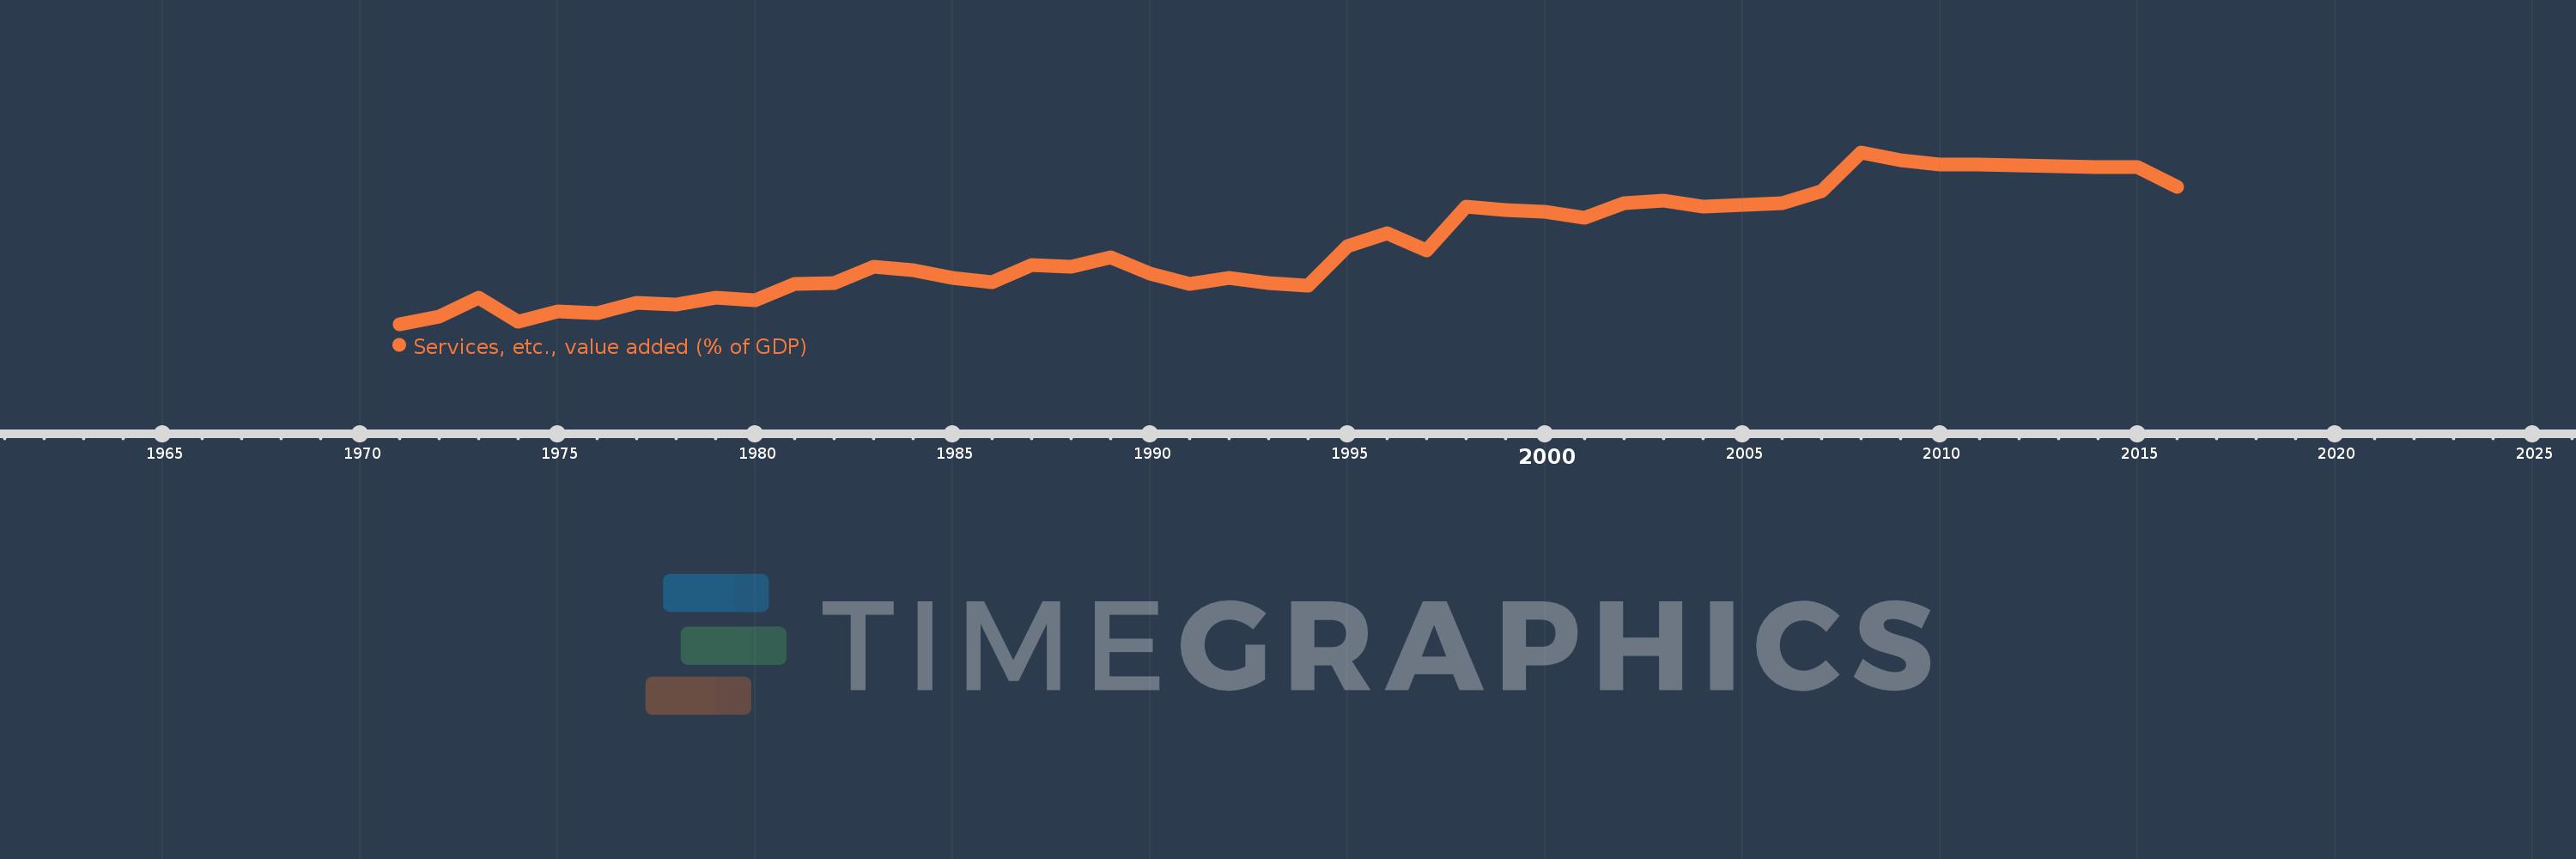
Services, etc., value added (% of GDP)
2016,2015,2014,2013,2012,2011,2010,2009,2008,2007,2006,2005,2004,2003,2002,2001,2000,1999,1998,1997,1996,1995,1994,1993,1992,1991,1990,1989,1988,1987,1986,1985,1984,1983,1982,1981,1980,1979,1978,1977,1976,1975,1974,1973,1972,1971
Estas estatísticas em outros países:
AfghanistanAlbaniaAlgeriaAndorraAngolaAntigua and BarbudaArab WorldArgentinaArmeniaArubaAustraliaAustriaAzerbaijanBahamas, TheBahrainBangladeshBarbadosBelarusBelgiumBelizeBeninBermudaBhutanBoliviaBosnia and HerzegovinaBotswanaBrazilBrunei DarussalamBulgariaBurkina FasoBurundiCabo VerdeCambodiaCameroonCanadaCaribbean small statesCentral African RepublicCentral Europe and the BalticsChadChileChinaColombiaComorosCongo, Dem. Rep.Congo, Rep.Costa RicaCote d'IvoireCroatiaCubaCyprusCzech RepublicDenmarkDjiboutiDominicaDominican RepublicEarly-demographic dividendEast Asia & PacificEast Asia & Pacific (excluding high income)East Asia & Pacific (IDA & IBRD countries)EcuadorEgypt, Arab Rep.El SalvadorEquatorial GuineaEritreaEstoniaEthiopiaEuro areaEurope & Central AsiaEurope & Central Asia (excluding high income)Europe & Central Asia (IDA & IBRD countries)European UnionFaroe IslandsFijiFinlandFragile and conflict affected situationsFranceGabonGambia, TheGeorgiaGermanyGhanaGreeceGrenadaGuatemalaGuineaGuinea-BissauGuyanaHeavily indebted poor countries (HIPC)High incomeHondurasHong Kong SAR, ChinaHungaryIBRD onlyIcelandIDA & IBRD totalIDA blendIDA onlyIDA totalIndiaIndonesiaIran, Islamic Rep.IrelandItalyJamaicaJapanJordanKazakhstanKenyaKiribatiKorea, Rep.KosovoKuwaitKyrgyz RepublicLao PDRLate-demographic dividendLatin America & Caribbean Latin America & Caribbean (excluding high income)Latin America & the Caribbean (IDA & IBRD countries)LatviaLeast developed countries: UN classificationLebanonLesothoLibyaLithuaniaLow & middle incomeLow incomeLower middle incomeLuxembourgMacao SAR, ChinaMacedonia, FYRMadagascarMalawiMalaysiaMaldivesMaliMaltaMarshall IslandsMauritaniaMauritiusMexicoMicronesia, Fed. Sts.Middle East & North AfricaMiddle East & North Africa (excluding high income)Middle East & North Africa (IDA & IBRD countries)Middle incomeMoldovaMongoliaMontenegroMoroccoMozambiqueMyanmarNamibiaNepalNetherlandsNew CaledoniaNew ZealandNicaraguaNigerNigeriaNorth AmericaNorwayOECD membersOmanOther small statesPacific island small statesPakistanPalauPanamaPapua New GuineaParaguayPeruPhilippinesPolandPortugalPost-demographic dividendPre-demographic dividendPuerto RicoQatarRomaniaRussian FederationRwandaSao Tome and PrincipeSaudi ArabiaSenegalSerbiaSeychellesSierra LeoneSingaporeSlovak RepublicSloveniaSmall statesSolomon IslandsSomaliaSouth AfricaSouth AsiaSouth Asia (IDA & IBRD)SpainSri LankaSt. Kitts and NevisSt. LuciaSt. Vincent and the GrenadinesSub-Saharan Africa Sub-Saharan Africa (excluding high income)Sub-Saharan Africa (IDA & IBRD countries)SudanSurinameSwazilandSwedenSwitzerlandSyrian Arab RepublicTajikistanTanzaniaThailandTimor-LesteTogoTongaTrinidad and TobagoTunisiaTurkeyTurkmenistanTuvaluUgandaUkraineUnited KingdomUnited StatesUpper middle incomeUruguayUzbekistanVanuatuVenezuela, RBVietnamWest Bank and GazaWorldYemen, Rep.ZambiaZimbabwe Linha do tempo:
Nesta escala de tempo está apresentado um gráfico de 1971 ano até 2016 ano Burundi. Dados de 1970 ano ausente. O número de observações reais por data: 46.
Fonte (nome):
Indicadores de desenvolvimento mundial
Fonte (organização):
World Bank national accounts data, and OECD National Accounts data files.
Categorias:
Economy & Growth
Foi atualizado:
23 abr 2017 ano
Indicadores de alterações dos valores ao longo dos anos
Mínimo:
19.201
1 jan 1971 ano
Máximo:
44.626
1 jan 2008 ano
Na data de observação
Valor
Mudança absoluta
A alteração em relação ao valor anterior
1 jan 1971 ano
19.201
+19.201
0.0%
1 jan 1972 ano
20.304
+1.103
5.74%
1 jan 1973 ano
23.073
+2.769
13.64%
1 jan 1974 ano
19.564
-3.509
-15.21%
1 jan 1975 ano
21.053
+1.489
7.61%
1 jan 1976 ano
20.85
-0.202
-0.96%
1 jan 1977 ano
22.418
+1.567
7.52%
1 jan 1978 ano
22.163
-0.255
-1.14%
1 jan 1979 ano
23.189
+1.027
4.63%
1 jan 1980 ano
22.806
-0.383
-1.65%
1 jan 1981 ano
25.131
+2.325
10.19%
1 jan 1982 ano
25.27
+0.139
0.55%
1 jan 1983 ano
27.696
+2.426
9.6%
1 jan 1984 ano
27.253
-0.443
-1.6%
1 jan 1985 ano
26.029
-1.225
-4.49%
1 jan 1986 ano
25.461
-0.568
-2.18%
1 jan 1987 ano
27.96
+2.499
9.81%
1 jan 1988 ano
27.762
-0.198
-0.71%
1 jan 1989 ano
29.088
+1.326
4.78%
1 jan 1990 ano
26.657
-2.431
-8.36%
1 jan 1991 ano
25.158
-1.499
-5.62%
1 jan 1992 ano
26.093
+0.935
3.72%
1 jan 1993 ano
25.294
-0.799
-3.06%
1 jan 1994 ano
24.933
-0.361
-1.43%
1 jan 1995 ano
30.744
+5.811
23.3%
1 jan 1996 ano
32.607
+1.863
6.06%
1 jan 1997 ano
30.148
-2.459
-7.54%
1 jan 1998 ano
36.645
+6.497
21.55%
1 jan 1999 ano
36.125
-0.52
-1.42%
1 jan 2000 ano
35.904
-0.221
-0.61%
1 jan 2001 ano
35.008
-0.896
-2.5%
1 jan 2002 ano
37.069
+2.061
5.89%
1 jan 2003 ano
37.515
+0.447
1.2%
1 jan 2004 ano
36.605
-0.91
-2.43%
1 jan 2005 ano
36.852
+0.247
0.68%
1 jan 2006 ano
37.05
+0.198
0.54%
1 jan 2007 ano
38.945
+1.895
5.11%
1 jan 2008 ano
44.626
+5.68
14.58%
1 jan 2009 ano
43.426
-1.2
-2.69%
1 jan 2010 ano
42.836
-0.59
-1.36%
1 jan 2011 ano
42.847
+0.011
0.03%
1 jan 2012 ano
42.753
-0.094
-0.22%
1 jan 2013 ano
42.532
-0.221
-0.52%
1 jan 2014 ano
42.439
-0.093
-0.22%
1 jan 2015 ano
42.427
-0.011
-0.03%
1 jan 2016 ano
39.486
-2.942
-6.93%
Classificação de países por estatísticas atuais por anos


Comentários: