29
/pt/
pt
AIzaSyAYiBZKx7MnpbEhh9jyipgxe19OcubqV5w
April 1, 2024
278260
Uruguay
URY
true
2
1
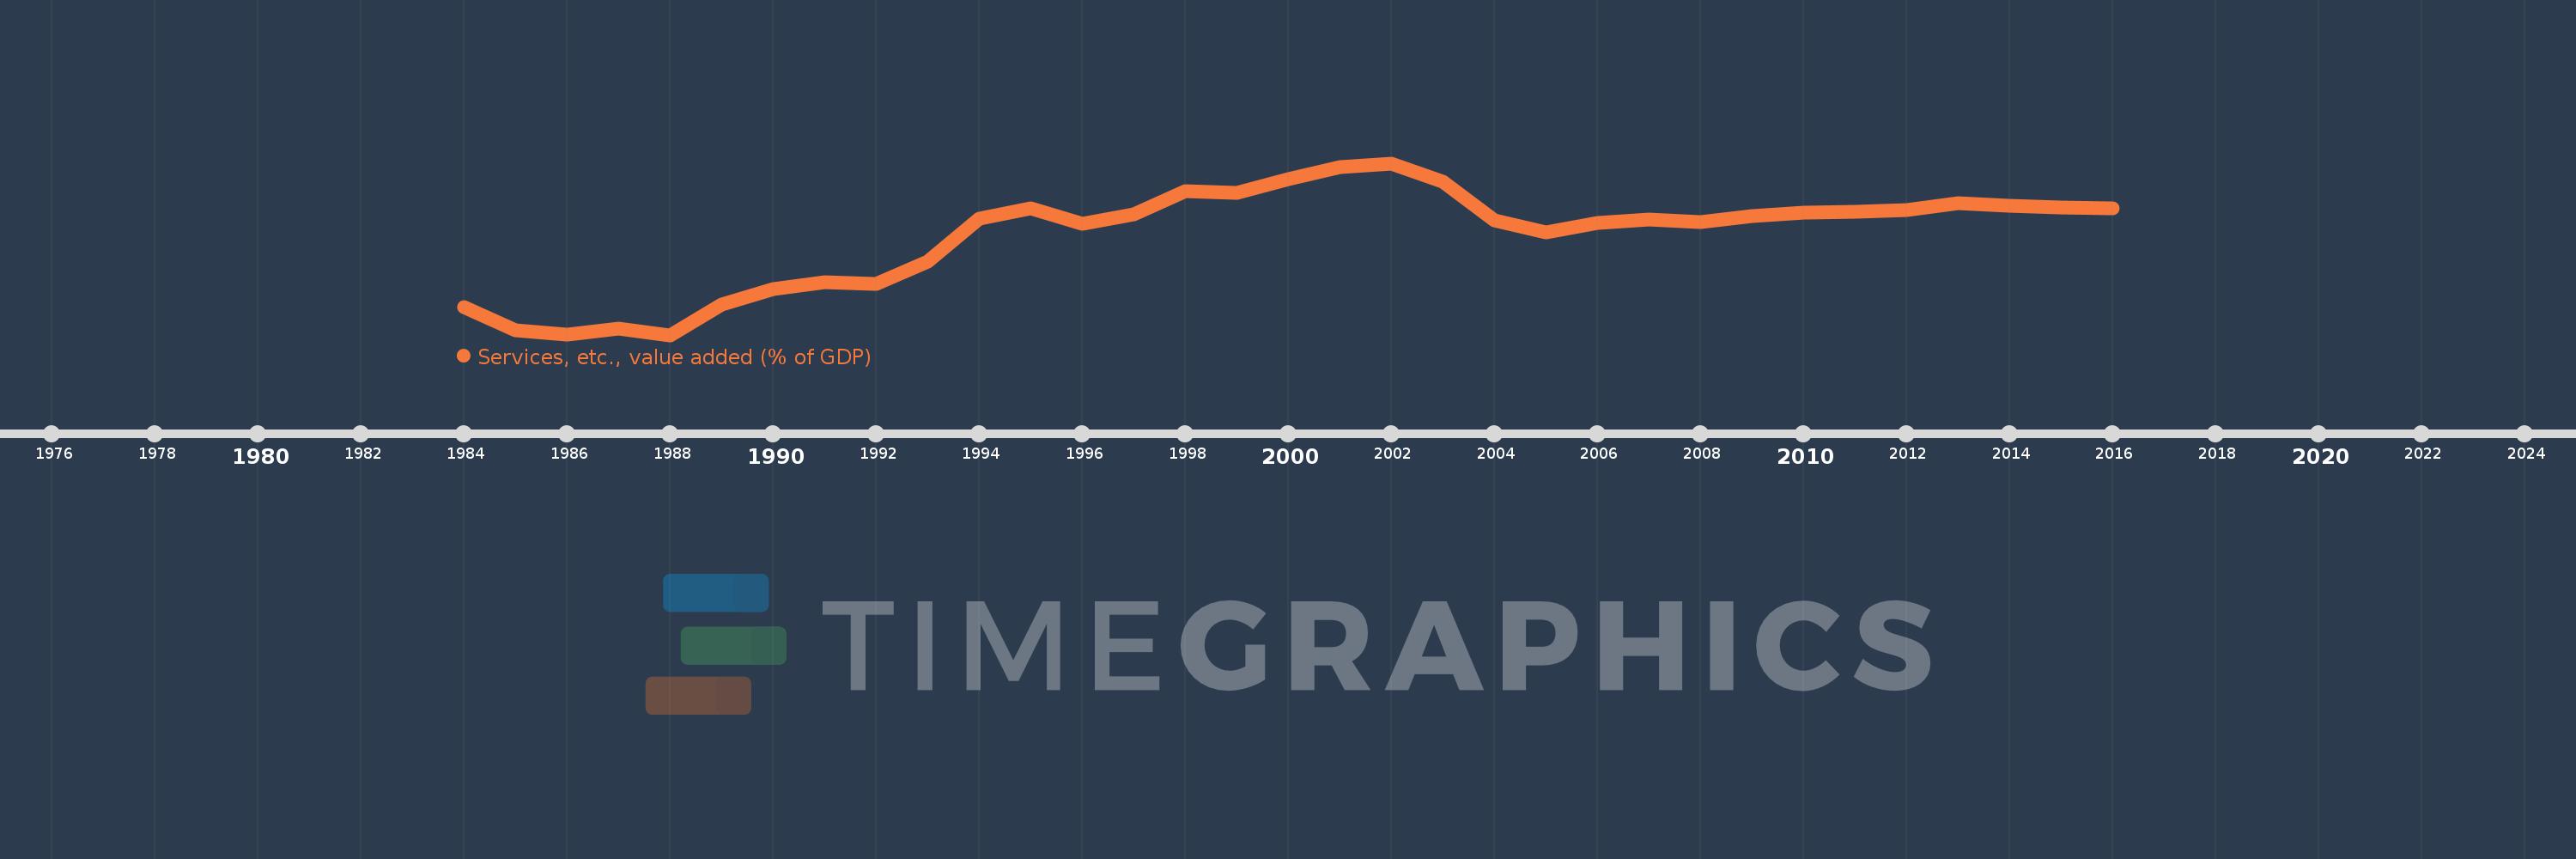
Services, etc., value added (% of GDP)
2016,2015,2014,2013,2012,2011,2010,2009,2008,2007,2006,2005,2004,2003,2002,2001,2000,1999,1998,1997,1996,1995,1994,1993,1992,1991,1990,1989,1988,1987,1986,1985,1984
Estas estatísticas em outros países:
AfghanistanAlbaniaAlgeriaAndorraAngolaAntigua and BarbudaArab WorldArgentinaArmeniaArubaAustraliaAustriaAzerbaijanBahamas, TheBahrainBangladeshBarbadosBelarusBelgiumBelizeBeninBermudaBhutanBoliviaBosnia and HerzegovinaBotswanaBrazilBrunei DarussalamBulgariaBurkina FasoBurundiCabo VerdeCambodiaCameroonCanadaCaribbean small statesCentral African RepublicCentral Europe and the BalticsChadChileChinaColombiaComorosCongo, Dem. Rep.Congo, Rep.Costa RicaCote d'IvoireCroatiaCubaCyprusCzech RepublicDenmarkDjiboutiDominicaDominican RepublicEarly-demographic dividendEast Asia & PacificEast Asia & Pacific (excluding high income)East Asia & Pacific (IDA & IBRD countries)EcuadorEgypt, Arab Rep.El SalvadorEquatorial GuineaEritreaEstoniaEthiopiaEuro areaEurope & Central AsiaEurope & Central Asia (excluding high income)Europe & Central Asia (IDA & IBRD countries)European UnionFaroe IslandsFijiFinlandFragile and conflict affected situationsFranceGabonGambia, TheGeorgiaGermanyGhanaGreeceGrenadaGuatemalaGuineaGuinea-BissauGuyanaHeavily indebted poor countries (HIPC)High incomeHondurasHong Kong SAR, ChinaHungaryIBRD onlyIcelandIDA & IBRD totalIDA blendIDA onlyIDA totalIndiaIndonesiaIran, Islamic Rep.IrelandItalyJamaicaJapanJordanKazakhstanKenyaKiribatiKorea, Rep.KosovoKuwaitKyrgyz RepublicLao PDRLate-demographic dividendLatin America & Caribbean Latin America & Caribbean (excluding high income)Latin America & the Caribbean (IDA & IBRD countries)LatviaLeast developed countries: UN classificationLebanonLesothoLibyaLithuaniaLow & middle incomeLow incomeLower middle incomeLuxembourgMacao SAR, ChinaMacedonia, FYRMadagascarMalawiMalaysiaMaldivesMaliMaltaMarshall IslandsMauritaniaMauritiusMexicoMicronesia, Fed. Sts.Middle East & North AfricaMiddle East & North Africa (excluding high income)Middle East & North Africa (IDA & IBRD countries)Middle incomeMoldovaMongoliaMontenegroMoroccoMozambiqueMyanmarNamibiaNepalNetherlandsNew CaledoniaNew ZealandNicaraguaNigerNigeriaNorth AmericaNorwayOECD membersOmanOther small statesPacific island small statesPakistanPalauPanamaPapua New GuineaParaguayPeruPhilippinesPolandPortugalPost-demographic dividendPre-demographic dividendPuerto RicoQatarRomaniaRussian FederationRwandaSao Tome and PrincipeSaudi ArabiaSenegalSerbiaSeychellesSierra LeoneSingaporeSlovak RepublicSloveniaSmall statesSolomon IslandsSomaliaSouth AfricaSouth AsiaSouth Asia (IDA & IBRD)SpainSri LankaSt. Kitts and NevisSt. LuciaSt. Vincent and the GrenadinesSub-Saharan Africa Sub-Saharan Africa (excluding high income)Sub-Saharan Africa (IDA & IBRD countries)SudanSurinameSwazilandSwedenSwitzerlandSyrian Arab RepublicTajikistanTanzaniaThailandTimor-LesteTogoTongaTrinidad and TobagoTunisiaTurkeyTurkmenistanTuvaluUgandaUkraineUnited KingdomUnited StatesUpper middle incomeUruguayUzbekistanVanuatuVenezuela, RBVietnamWest Bank and GazaWorldYemen, Rep.ZambiaZimbabwe Linha do tempo:
Nesta escala de tempo está apresentado um gráfico de 1984 ano até 2016 ano Uruguay. Dados de 1983 ano ausente. O número de observações reais por data: 33.
Fonte (nome):
Indicadores de desenvolvimento mundial
Fonte (organização):
World Bank national accounts data, and OECD National Accounts data files.
Categorias:
Economy & Growth
Foi atualizado:
23 abr 2017 ano
Indicadores de alterações dos valores ao longo dos anos
Mínimo:
50.455
1 jan 1988 ano
Máximo:
68.95
1 jan 2002 ano
Na data de observação
Valor
Mudança absoluta
A alteração em relação ao valor anterior
1 jan 1984 ano
53.458
+53.458
0.0%
1 jan 1985 ano
50.96
-2.498
-4.67%
1 jan 1986 ano
50.457
-0.503
-0.99%
1 jan 1987 ano
51.122
+0.665
1.32%
1 jan 1988 ano
50.455
-0.667
-1.3%
1 jan 1989 ano
53.756
+3.301
6.54%
1 jan 1990 ano
55.432
+1.676
3.12%
1 jan 1991 ano
56.149
+0.717
1.29%
1 jan 1992 ano
55.954
-0.196
-0.35%
1 jan 1993 ano
58.402
+2.449
4.38%
1 jan 1994 ano
62.969
+4.567
7.82%
1 jan 1995 ano
64.078
+1.109
1.76%
1 jan 1996 ano
62.465
-1.613
-2.52%
1 jan 1997 ano
63.438
+0.974
1.56%
1 jan 1998 ano
65.92
+2.482
3.91%
1 jan 1999 ano
65.781
-0.14
-0.21%
1 jan 2000 ano
67.267
+1.486
2.26%
1 jan 2001 ano
68.53
+1.263
1.88%
1 jan 2002 ano
68.95
+0.421
0.61%
1 jan 2003 ano
66.986
-1.964
-2.85%
1 jan 2004 ano
62.798
-4.189
-6.25%
1 jan 2005 ano
61.512
-1.286
-2.05%
1 jan 2006 ano
62.498
+0.986
1.6%
1 jan 2007 ano
62.88
+0.382
0.61%
1 jan 2008 ano
62.631
-0.249
-0.4%
1 jan 2009 ano
63.295
+0.664
1.06%
1 jan 2010 ano
63.592
+0.297
0.47%
1 jan 2011 ano
63.7
+0.108
0.17%
1 jan 2012 ano
63.867
+0.167
0.26%
1 jan 2013 ano
64.622
+0.755
1.18%
1 jan 2014 ano
64.332
-0.29
-0.45%
1 jan 2015 ano
64.215
-0.117
-0.18%
1 jan 2016 ano
64.057
-0.157
-0.25%
Classificação de países por estatísticas atuais por anos


Comentários: