29
/pt/
pt
AIzaSyAYiBZKx7MnpbEhh9jyipgxe19OcubqV5w
April 1, 2024
25326
Caribbean small states
CSS
false
2
1
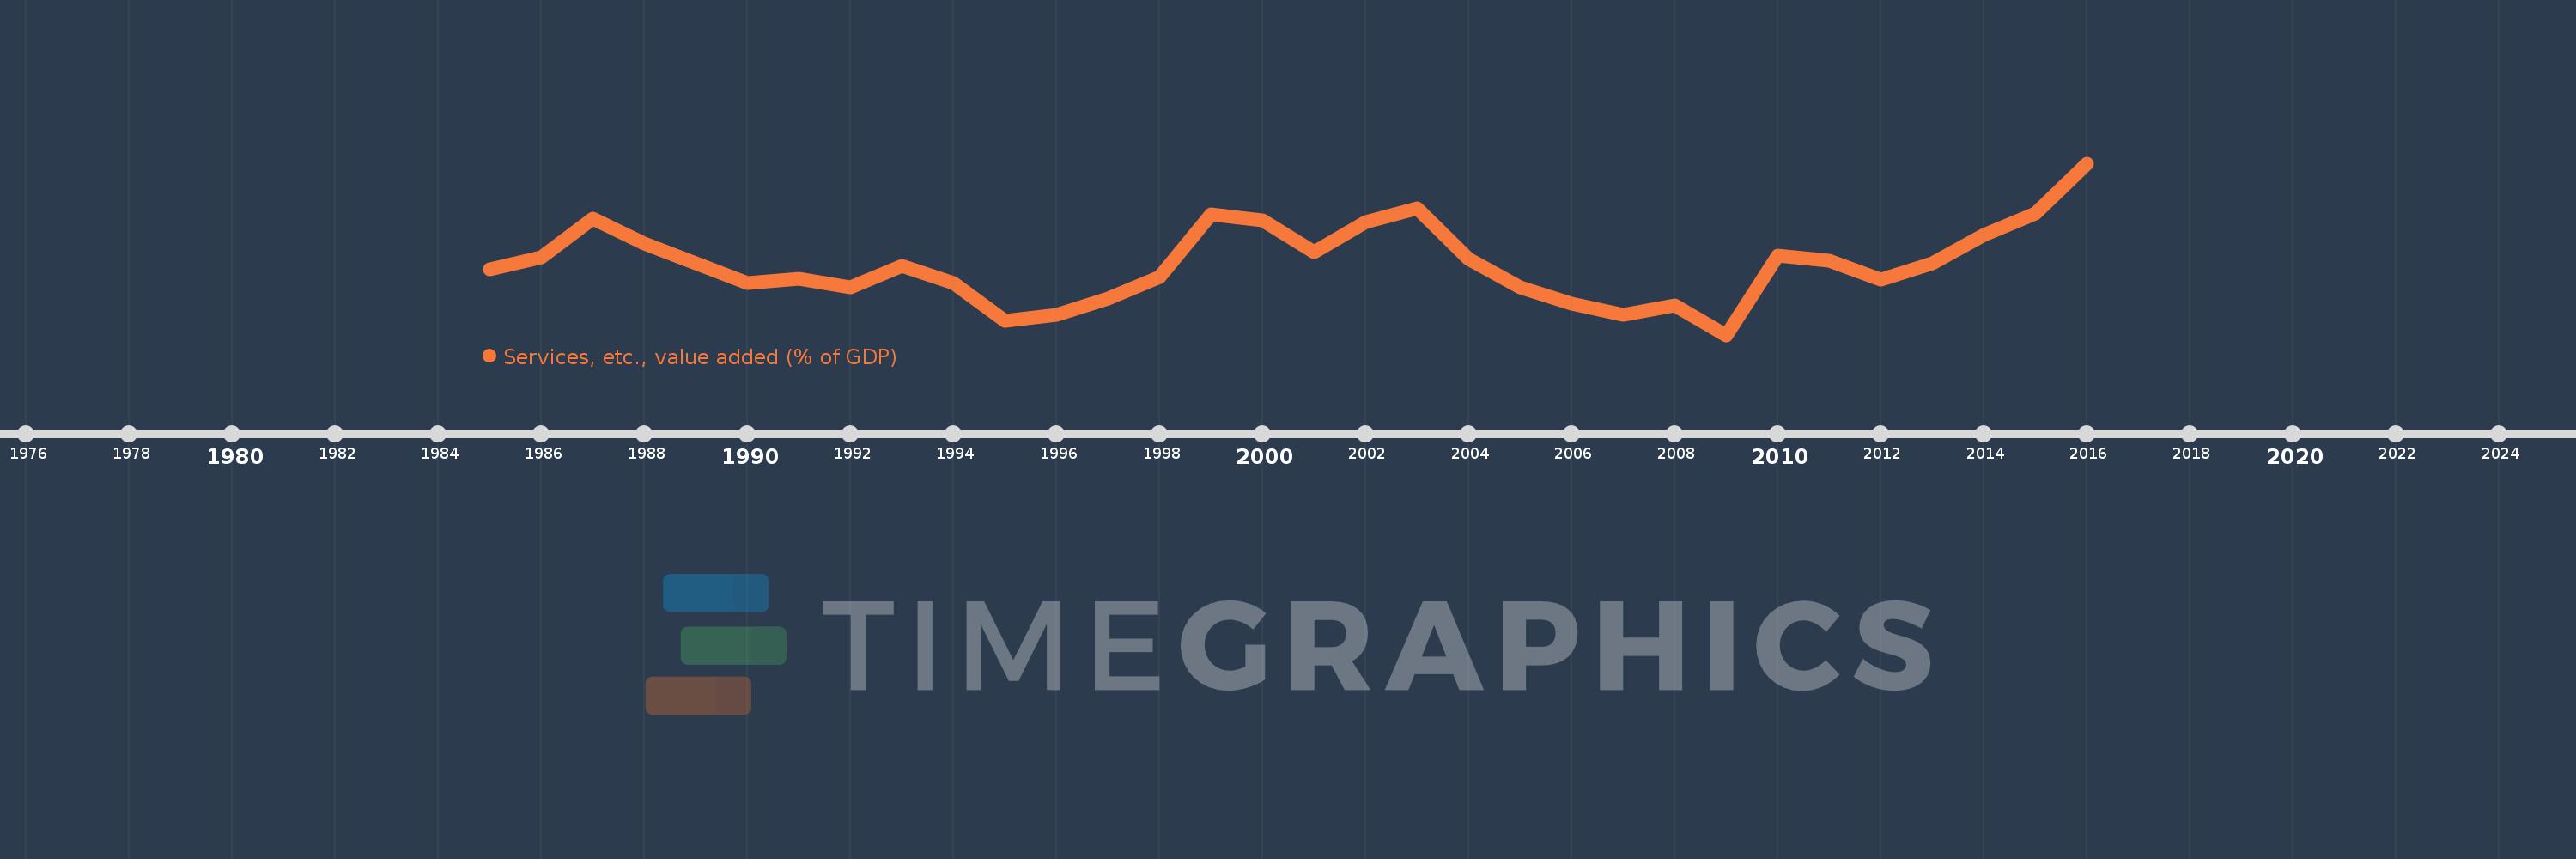
Services, etc., value added (% of GDP)
2016,2015,2014,2013,2012,2011,2010,2009,2008,2007,2006,2005,2004,2003,2002,2001,2000,1999,1998,1997,1996,1995,1994,1993,1992,1991,1990,1988,1987,1986,1985
Estas estatísticas em outros países:
AfghanistanAlbaniaAlgeriaAndorraAngolaAntigua and BarbudaArab WorldArgentinaArmeniaArubaAustraliaAustriaAzerbaijanBahamas, TheBahrainBangladeshBarbadosBelarusBelgiumBelizeBeninBermudaBhutanBoliviaBosnia and HerzegovinaBotswanaBrazilBrunei DarussalamBulgariaBurkina FasoBurundiCabo VerdeCambodiaCameroonCanadaCaribbean small statesCentral African RepublicCentral Europe and the BalticsChadChileChinaColombiaComorosCongo, Dem. Rep.Congo, Rep.Costa RicaCote d'IvoireCroatiaCubaCyprusCzech RepublicDenmarkDjiboutiDominicaDominican RepublicEarly-demographic dividendEast Asia & PacificEast Asia & Pacific (excluding high income)East Asia & Pacific (IDA & IBRD countries)EcuadorEgypt, Arab Rep.El SalvadorEquatorial GuineaEritreaEstoniaEthiopiaEuro areaEurope & Central AsiaEurope & Central Asia (excluding high income)Europe & Central Asia (IDA & IBRD countries)European UnionFaroe IslandsFijiFinlandFragile and conflict affected situationsFranceGabonGambia, TheGeorgiaGermanyGhanaGreeceGrenadaGuatemalaGuineaGuinea-BissauGuyanaHeavily indebted poor countries (HIPC)High incomeHondurasHong Kong SAR, ChinaHungaryIBRD onlyIcelandIDA & IBRD totalIDA blendIDA onlyIDA totalIndiaIndonesiaIran, Islamic Rep.IrelandItalyJamaicaJapanJordanKazakhstanKenyaKiribatiKorea, Rep.KosovoKuwaitKyrgyz RepublicLao PDRLate-demographic dividendLatin America & Caribbean Latin America & Caribbean (excluding high income)Latin America & the Caribbean (IDA & IBRD countries)LatviaLeast developed countries: UN classificationLebanonLesothoLibyaLithuaniaLow & middle incomeLow incomeLower middle incomeLuxembourgMacao SAR, ChinaMacedonia, FYRMadagascarMalawiMalaysiaMaldivesMaliMaltaMarshall IslandsMauritaniaMauritiusMexicoMicronesia, Fed. Sts.Middle East & North AfricaMiddle East & North Africa (excluding high income)Middle East & North Africa (IDA & IBRD countries)Middle incomeMoldovaMongoliaMontenegroMoroccoMozambiqueMyanmarNamibiaNepalNetherlandsNew CaledoniaNew ZealandNicaraguaNigerNigeriaNorth AmericaNorwayOECD membersOmanOther small statesPacific island small statesPakistanPalauPanamaPapua New GuineaParaguayPeruPhilippinesPolandPortugalPost-demographic dividendPre-demographic dividendPuerto RicoQatarRomaniaRussian FederationRwandaSao Tome and PrincipeSaudi ArabiaSenegalSerbiaSeychellesSierra LeoneSingaporeSlovak RepublicSloveniaSmall statesSolomon IslandsSomaliaSouth AfricaSouth AsiaSouth Asia (IDA & IBRD)SpainSri LankaSt. Kitts and NevisSt. LuciaSt. Vincent and the GrenadinesSub-Saharan Africa Sub-Saharan Africa (excluding high income)Sub-Saharan Africa (IDA & IBRD countries)SudanSurinameSwazilandSwedenSwitzerlandSyrian Arab RepublicTajikistanTanzaniaThailandTimor-LesteTogoTongaTrinidad and TobagoTunisiaTurkeyTurkmenistanTuvaluUgandaUkraineUnited KingdomUnited StatesUpper middle incomeUruguayUzbekistanVanuatuVenezuela, RBVietnamWest Bank and GazaWorldYemen, Rep.ZambiaZimbabwe Linha do tempo:
Nesta escala de tempo está apresentado um gráfico de 1985 ano até 2016 ano Caribbean small states. Dados de 1984 ano ausente. O número de observações reais por data: 31.
Fonte (nome):
Indicadores de desenvolvimento mundial
Fonte (organização):
World Bank national accounts data, and OECD National Accounts data files.
Categorias:
Economy & Growth
Foi atualizado:
23 abr 2017 ano
Indicadores de alterações dos valores ao longo dos anos
Mínimo:
56.876
1 jan 2009 ano
Máximo:
66.847
1 jan 2016 ano
Na data de observação
Valor
Mudança absoluta
A alteração em relação ao valor anterior
1 jan 1985 ano
60.7
+60.7
0.0%
1 jan 1986 ano
61.408
+0.708
1.17%
1 jan 1987 ano
63.644
+2.236
3.64%
1 jan 1988 ano
62.203
-1.441
-2.26%
1 jan 1990 ano
59.897
-2.306
-3.71%
1 jan 1991 ano
60.124
+0.227
0.38%
1 jan 1992 ano
59.66
-0.464
-0.77%
1 jan 1993 ano
60.879
+1.219
2.04%
1 jan 1994 ano
59.905
-0.975
-1.6%
1 jan 1995 ano
57.721
-2.183
-3.64%
1 jan 1996 ano
58.031
+0.309
0.54%
1 jan 1997 ano
58.999
+0.968
1.67%
1 jan 1998 ano
60.245
+1.247
2.11%
1 jan 1999 ano
63.857
+3.612
5.99%
1 jan 2000 ano
63.547
-0.31
-0.49%
1 jan 2001 ano
61.666
-1.881
-2.96%
1 jan 2002 ano
63.444
+1.778
2.88%
1 jan 2003 ano
64.22
+0.776
1.22%
1 jan 2004 ano
61.27
-2.95
-4.59%
1 jan 2005 ano
59.654
-1.616
-2.64%
1 jan 2006 ano
58.706
-0.948
-1.59%
1 jan 2007 ano
58.069
-0.637
-1.09%
1 jan 2008 ano
58.573
+0.504
0.87%
1 jan 2009 ano
56.876
-1.697
-2.9%
1 jan 2010 ano
61.485
+4.609
8.1%
1 jan 2011 ano
61.182
-0.303
-0.49%
1 jan 2012 ano
60.074
-1.108
-1.81%
1 jan 2013 ano
61.06
+0.986
1.64%
1 jan 2014 ano
62.707
+1.648
2.7%
1 jan 2015 ano
63.925
+1.218
1.94%
1 jan 2016 ano
66.847
+2.921
4.57%
Classificação de países por estatísticas atuais por anos


Comentários: