29
/pt/
pt
AIzaSyAYiBZKx7MnpbEhh9jyipgxe19OcubqV5w
April 1, 2024
46673
Low income
LIC
false
2
1
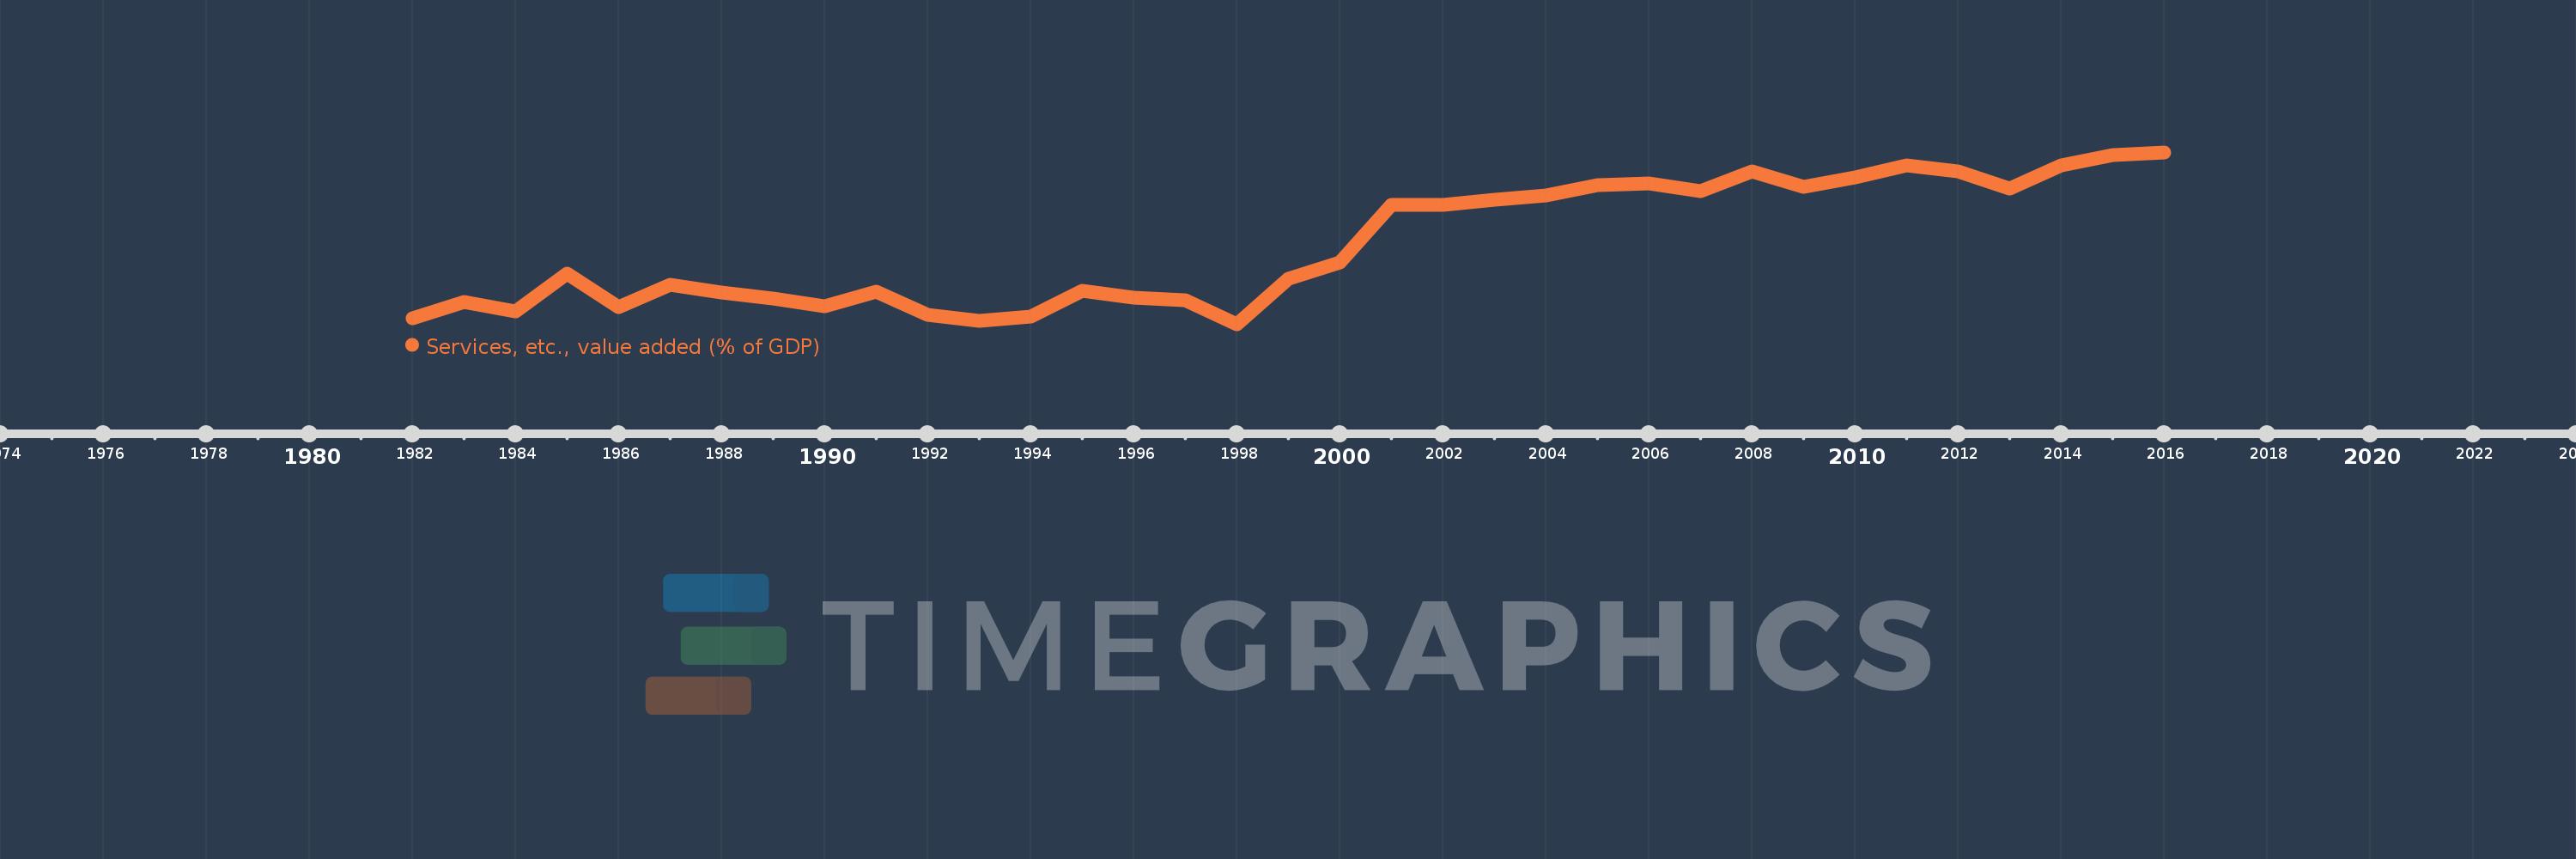
Services, etc., value added (% of GDP)
2016,2015,2014,2013,2012,2011,2010,2009,2008,2007,2006,2005,2004,2003,2002,2001,2000,1999,1998,1997,1996,1995,1994,1993,1992,1991,1990,1989,1988,1987,1986,1985,1984,1983,1982
Estas estatísticas em outros países:
AfghanistanAlbaniaAlgeriaAndorraAngolaAntigua and BarbudaArab WorldArgentinaArmeniaArubaAustraliaAustriaAzerbaijanBahamas, TheBahrainBangladeshBarbadosBelarusBelgiumBelizeBeninBermudaBhutanBoliviaBosnia and HerzegovinaBotswanaBrazilBrunei DarussalamBulgariaBurkina FasoBurundiCabo VerdeCambodiaCameroonCanadaCaribbean small statesCentral African RepublicCentral Europe and the BalticsChadChileChinaColombiaComorosCongo, Dem. Rep.Congo, Rep.Costa RicaCote d'IvoireCroatiaCubaCyprusCzech RepublicDenmarkDjiboutiDominicaDominican RepublicEarly-demographic dividendEast Asia & PacificEast Asia & Pacific (excluding high income)East Asia & Pacific (IDA & IBRD countries)EcuadorEgypt, Arab Rep.El SalvadorEquatorial GuineaEritreaEstoniaEthiopiaEuro areaEurope & Central AsiaEurope & Central Asia (excluding high income)Europe & Central Asia (IDA & IBRD countries)European UnionFaroe IslandsFijiFinlandFragile and conflict affected situationsFranceGabonGambia, TheGeorgiaGermanyGhanaGreeceGrenadaGuatemalaGuineaGuinea-BissauGuyanaHeavily indebted poor countries (HIPC)High incomeHondurasHong Kong SAR, ChinaHungaryIBRD onlyIcelandIDA & IBRD totalIDA blendIDA onlyIDA totalIndiaIndonesiaIran, Islamic Rep.IrelandItalyJamaicaJapanJordanKazakhstanKenyaKiribatiKorea, Rep.KosovoKuwaitKyrgyz RepublicLao PDRLate-demographic dividendLatin America & Caribbean Latin America & Caribbean (excluding high income)Latin America & the Caribbean (IDA & IBRD countries)LatviaLeast developed countries: UN classificationLebanonLesothoLibyaLithuaniaLow & middle incomeLow incomeLower middle incomeLuxembourgMacao SAR, ChinaMacedonia, FYRMadagascarMalawiMalaysiaMaldivesMaliMaltaMarshall IslandsMauritaniaMauritiusMexicoMicronesia, Fed. Sts.Middle East & North AfricaMiddle East & North Africa (excluding high income)Middle East & North Africa (IDA & IBRD countries)Middle incomeMoldovaMongoliaMontenegroMoroccoMozambiqueMyanmarNamibiaNepalNetherlandsNew CaledoniaNew ZealandNicaraguaNigerNigeriaNorth AmericaNorwayOECD membersOmanOther small statesPacific island small statesPakistanPalauPanamaPapua New GuineaParaguayPeruPhilippinesPolandPortugalPost-demographic dividendPre-demographic dividendPuerto RicoQatarRomaniaRussian FederationRwandaSao Tome and PrincipeSaudi ArabiaSenegalSerbiaSeychellesSierra LeoneSingaporeSlovak RepublicSloveniaSmall statesSolomon IslandsSomaliaSouth AfricaSouth AsiaSouth Asia (IDA & IBRD)SpainSri LankaSt. Kitts and NevisSt. LuciaSt. Vincent and the GrenadinesSub-Saharan Africa Sub-Saharan Africa (excluding high income)Sub-Saharan Africa (IDA & IBRD countries)SudanSurinameSwazilandSwedenSwitzerlandSyrian Arab RepublicTajikistanTanzaniaThailandTimor-LesteTogoTongaTrinidad and TobagoTunisiaTurkeyTurkmenistanTuvaluUgandaUkraineUnited KingdomUnited StatesUpper middle incomeUruguayUzbekistanVanuatuVenezuela, RBVietnamWest Bank and GazaWorldYemen, Rep.ZambiaZimbabwe Linha do tempo:
Nesta escala de tempo está apresentado um gráfico de 1982 ano até 2016 ano Low income. Dados de 1981 ano ausente. O número de observações reais por data: 35.
Fonte (nome):
Indicadores de desenvolvimento mundial
Fonte (organização):
World Bank national accounts data, and OECD National Accounts data files.
Categorias:
Economy & Growth
Foi atualizado:
23 abr 2017 ano
Indicadores de alterações dos valores ao longo dos anos
Mínimo:
40.409
1 jan 1998 ano
Máximo:
47.632
1 jan 2016 ano
Na data de observação
Valor
Mudança absoluta
A alteração em relação ao valor anterior
1 jan 1982 ano
40.641
+40.641
0.0%
1 jan 1983 ano
41.356
+0.715
1.76%
1 jan 1984 ano
40.965
-0.391
-0.95%
1 jan 1985 ano
42.532
+1.567
3.82%
1 jan 1986 ano
41.128
-1.404
-3.3%
1 jan 1987 ano
42.055
+0.927
2.25%
1 jan 1988 ano
41.748
-0.307
-0.73%
1 jan 1989 ano
41.493
-0.254
-0.61%
1 jan 1990 ano
41.147
-0.347
-0.84%
1 jan 1991 ano
41.779
+0.632
1.54%
1 jan 1992 ano
40.79
-0.988
-2.37%
1 jan 1993 ano
40.549
-0.242
-0.59%
1 jan 1994 ano
40.731
+0.182
0.45%
1 jan 1995 ano
41.823
+1.092
2.68%
1 jan 1996 ano
41.54
-0.283
-0.68%
1 jan 1997 ano
41.42
-0.12
-0.29%
1 jan 1998 ano
40.409
-1.011
-2.44%
1 jan 1999 ano
42.317
+1.908
4.72%
1 jan 2000 ano
42.995
+0.678
1.6%
1 jan 2001 ano
45.425
+2.43
5.65%
1 jan 2002 ano
45.427
+0.002
0.0%
1 jan 2003 ano
45.647
+0.22
0.48%
1 jan 2004 ano
45.82
+0.173
0.38%
1 jan 2005 ano
46.248
+0.428
0.93%
1 jan 2006 ano
46.338
+0.091
0.2%
1 jan 2007 ano
45.991
-0.348
-0.75%
1 jan 2008 ano
46.834
+0.843
1.83%
1 jan 2009 ano
46.168
-0.666
-1.42%
1 jan 2010 ano
46.586
+0.418
0.91%
1 jan 2011 ano
47.099
+0.513
1.1%
1 jan 2012 ano
46.83
-0.269
-0.57%
1 jan 2013 ano
46.126
-0.704
-1.5%
1 jan 2014 ano
47.104
+0.979
2.12%
1 jan 2015 ano
47.52
+0.416
0.88%
1 jan 2016 ano
47.632
+0.113
0.24%
Classificação de países por estatísticas atuais por anos


Comentários: