29
/pt/
pt
AIzaSyAYiBZKx7MnpbEhh9jyipgxe19OcubqV5w
April 1, 2024
220227
Papua New Guinea
PNG
true
2
1
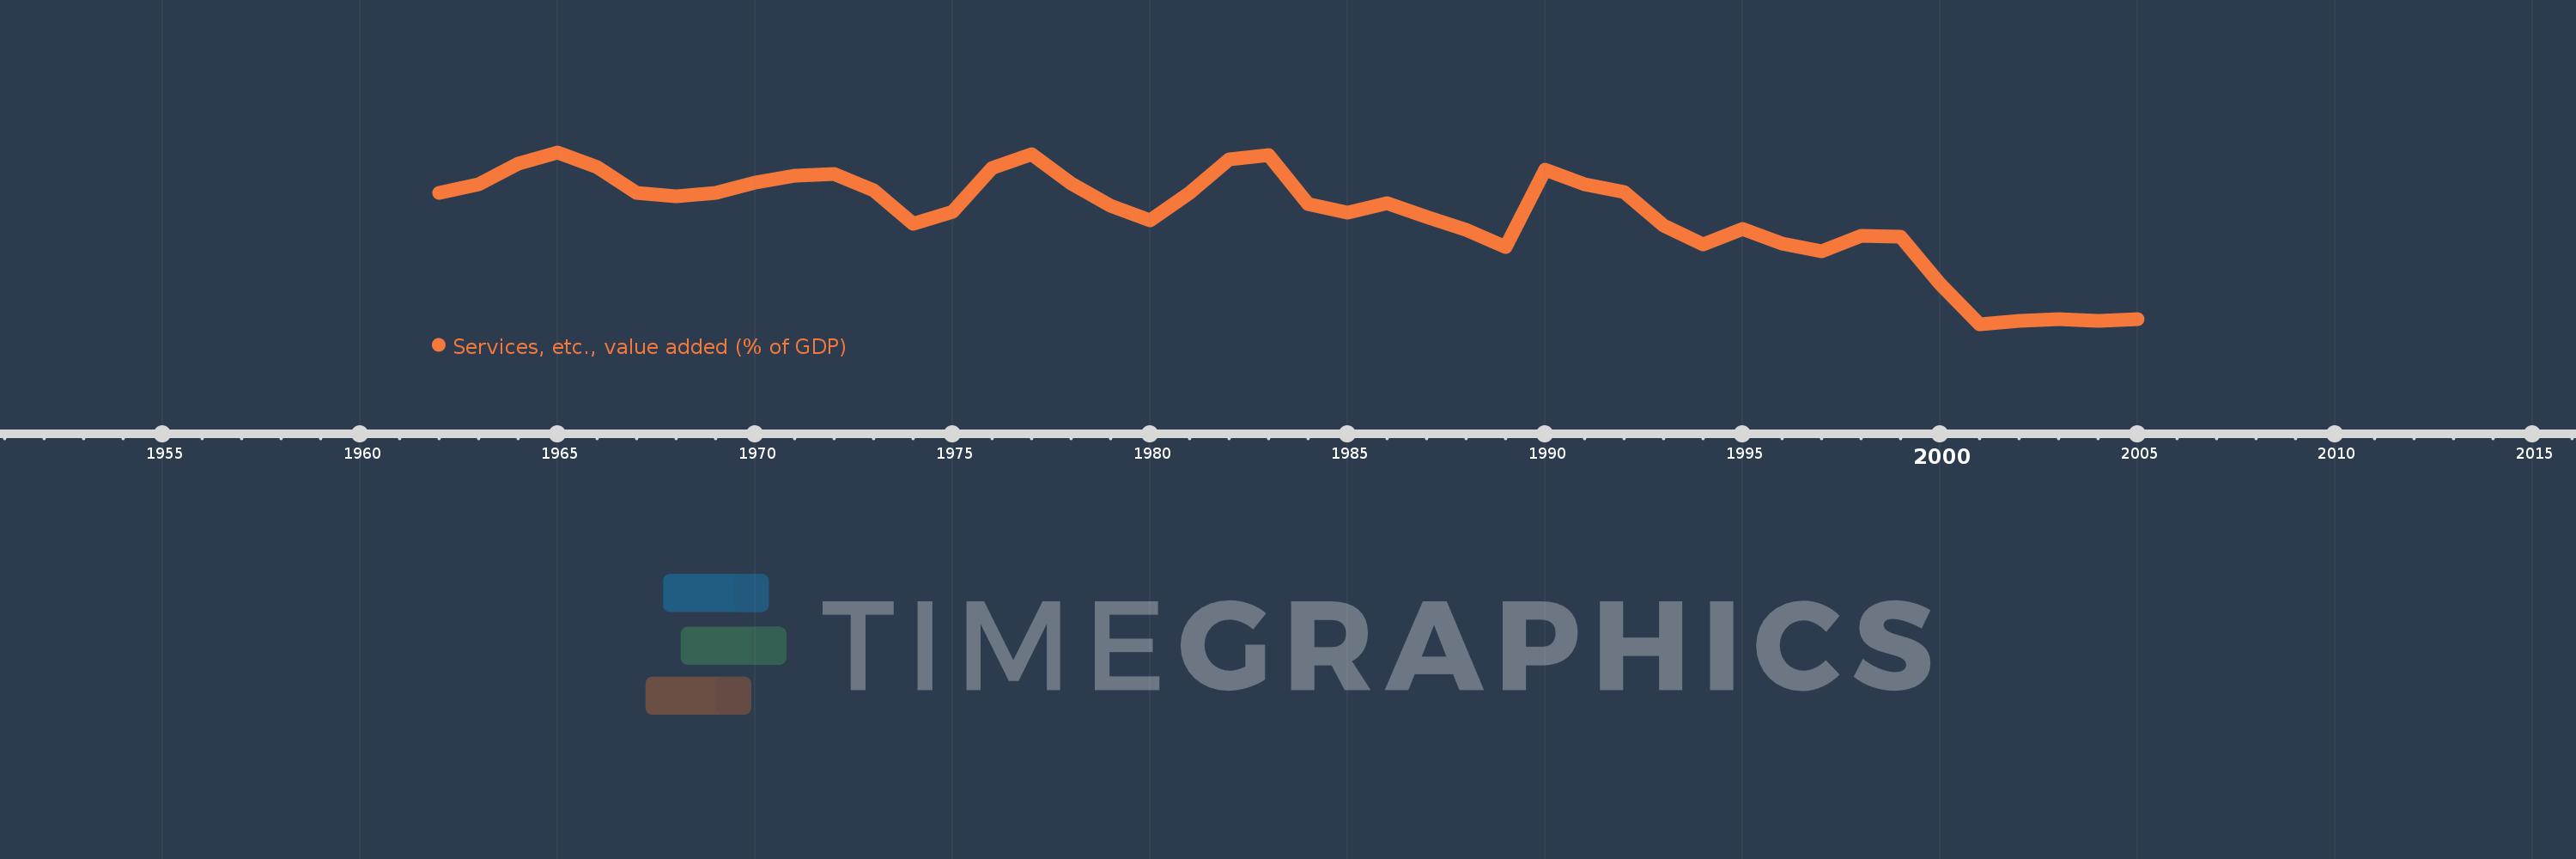
Services, etc., value added (% of GDP)
2005,2004,2003,2002,2001,2000,1999,1998,1997,1996,1995,1994,1993,1992,1991,1990,1989,1988,1987,1986,1985,1984,1983,1982,1981,1980,1979,1978,1977,1976,1975,1974,1973,1972,1971,1970,1969,1968,1967,1966,1965,1964,1963,1962
Estas estatísticas em outros países:
AfghanistanAlbaniaAlgeriaAndorraAngolaAntigua and BarbudaArab WorldArgentinaArmeniaArubaAustraliaAustriaAzerbaijanBahamas, TheBahrainBangladeshBarbadosBelarusBelgiumBelizeBeninBermudaBhutanBoliviaBosnia and HerzegovinaBotswanaBrazilBrunei DarussalamBulgariaBurkina FasoBurundiCabo VerdeCambodiaCameroonCanadaCaribbean small statesCentral African RepublicCentral Europe and the BalticsChadChileChinaColombiaComorosCongo, Dem. Rep.Congo, Rep.Costa RicaCote d'IvoireCroatiaCubaCyprusCzech RepublicDenmarkDjiboutiDominicaDominican RepublicEarly-demographic dividendEast Asia & PacificEast Asia & Pacific (excluding high income)East Asia & Pacific (IDA & IBRD countries)EcuadorEgypt, Arab Rep.El SalvadorEquatorial GuineaEritreaEstoniaEthiopiaEuro areaEurope & Central AsiaEurope & Central Asia (excluding high income)Europe & Central Asia (IDA & IBRD countries)European UnionFaroe IslandsFijiFinlandFragile and conflict affected situationsFranceGabonGambia, TheGeorgiaGermanyGhanaGreeceGrenadaGuatemalaGuineaGuinea-BissauGuyanaHeavily indebted poor countries (HIPC)High incomeHondurasHong Kong SAR, ChinaHungaryIBRD onlyIcelandIDA & IBRD totalIDA blendIDA onlyIDA totalIndiaIndonesiaIran, Islamic Rep.IrelandItalyJamaicaJapanJordanKazakhstanKenyaKiribatiKorea, Rep.KosovoKuwaitKyrgyz RepublicLao PDRLate-demographic dividendLatin America & Caribbean Latin America & Caribbean (excluding high income)Latin America & the Caribbean (IDA & IBRD countries)LatviaLeast developed countries: UN classificationLebanonLesothoLibyaLithuaniaLow & middle incomeLow incomeLower middle incomeLuxembourgMacao SAR, ChinaMacedonia, FYRMadagascarMalawiMalaysiaMaldivesMaliMaltaMarshall IslandsMauritaniaMauritiusMexicoMicronesia, Fed. Sts.Middle East & North AfricaMiddle East & North Africa (excluding high income)Middle East & North Africa (IDA & IBRD countries)Middle incomeMoldovaMongoliaMontenegroMoroccoMozambiqueMyanmarNamibiaNepalNetherlandsNew CaledoniaNew ZealandNicaraguaNigerNigeriaNorth AmericaNorwayOECD membersOmanOther small statesPacific island small statesPakistanPalauPanamaPapua New GuineaParaguayPeruPhilippinesPolandPortugalPost-demographic dividendPre-demographic dividendPuerto RicoQatarRomaniaRussian FederationRwandaSao Tome and PrincipeSaudi ArabiaSenegalSerbiaSeychellesSierra LeoneSingaporeSlovak RepublicSloveniaSmall statesSolomon IslandsSomaliaSouth AfricaSouth AsiaSouth Asia (IDA & IBRD)SpainSri LankaSt. Kitts and NevisSt. LuciaSt. Vincent and the GrenadinesSub-Saharan Africa Sub-Saharan Africa (excluding high income)Sub-Saharan Africa (IDA & IBRD countries)SudanSurinameSwazilandSwedenSwitzerlandSyrian Arab RepublicTajikistanTanzaniaThailandTimor-LesteTogoTongaTrinidad and TobagoTunisiaTurkeyTurkmenistanTuvaluUgandaUkraineUnited KingdomUnited StatesUpper middle incomeUruguayUzbekistanVanuatuVenezuela, RBVietnamWest Bank and GazaWorldYemen, Rep.ZambiaZimbabwe Linha do tempo:
Nesta escala de tempo está apresentado um gráfico de 1962 ano até 2005 ano Papua New Guinea. Dados de 1961 ano ausente. O número de observações reais por data: 44.
Fonte (nome):
Indicadores de desenvolvimento mundial
Fonte (organização):
World Bank national accounts data, and OECD National Accounts data files.
Categorias:
Economy & Growth
Foi atualizado:
23 abr 2017 ano
Indicadores de alterações dos valores ao longo dos anos
Mínimo:
22.808
1 jan 2001 ano
Máximo:
39.939
1 jan 1965 ano
Na data de observação
Valor
Mudança absoluta
A alteração em relação ao valor anterior
1 jan 1962 ano
35.899
+35.899
0.0%
1 jan 1963 ano
36.724
+0.825
2.3%
1 jan 1964 ano
38.847
+2.123
5.78%
1 jan 1965 ano
39.939
+1.092
2.81%
1 jan 1966 ano
38.451
-1.488
-3.73%
1 jan 1967 ano
35.884
-2.567
-6.68%
1 jan 1968 ano
35.588
-0.297
-0.83%
1 jan 1969 ano
35.941
+0.353
0.99%
1 jan 1970 ano
36.926
+0.985
2.74%
1 jan 1971 ano
37.635
+0.709
1.92%
1 jan 1972 ano
37.771
+0.136
0.36%
1 jan 1973 ano
36.194
-1.577
-4.17%
1 jan 1974 ano
32.796
-3.398
-9.39%
1 jan 1975 ano
34.045
+1.249
3.81%
1 jan 1976 ano
38.425
+4.38
12.87%
1 jan 1977 ano
39.788
+1.362
3.55%
1 jan 1978 ano
36.888
-2.9
-7.29%
1 jan 1979 ano
34.63
-2.258
-6.12%
1 jan 1980 ano
33.156
-1.475
-4.26%
1 jan 1981 ano
35.911
+2.756
8.31%
1 jan 1982 ano
39.225
+3.314
9.23%
1 jan 1983 ano
39.708
+0.483
1.23%
1 jan 1984 ano
34.814
-4.894
-12.33%
1 jan 1985 ano
33.909
-0.905
-2.6%
1 jan 1986 ano
34.909
+1.0
2.95%
1 jan 1987 ano
33.507
-1.402
-4.02%
1 jan 1988 ano
32.184
-1.323
-3.95%
1 jan 1989 ano
30.476
-1.709
-5.31%
1 jan 1990 ano
38.221
+7.745
25.41%
1 jan 1991 ano
36.752
-1.469
-3.84%
1 jan 1992 ano
36.031
-0.721
-1.96%
1 jan 1993 ano
32.654
-3.377
-9.37%
1 jan 1994 ano
30.739
-1.915
-5.86%
1 jan 1995 ano
32.324
+1.585
5.16%
1 jan 1996 ano
30.858
-1.466
-4.53%
1 jan 1997 ano
30.052
-0.806
-2.61%
1 jan 1998 ano
31.587
+1.535
5.11%
1 jan 1999 ano
31.511
-0.076
-0.24%
1 jan 2000 ano
26.829
-4.682
-14.86%
1 jan 2001 ano
22.808
-4.02
-14.99%
1 jan 2002 ano
23.166
+0.358
1.57%
1 jan 2003 ano
23.341
+0.175
0.75%
1 jan 2004 ano
23.12
-0.221
-0.95%
1 jan 2005 ano
23.333
+0.213
0.92%
Classificação de países por estatísticas atuais por anos


Comentários: