29
/pt/
pt
AIzaSyAYiBZKx7MnpbEhh9jyipgxe19OcubqV5w
April 1, 2024
280399
Vanuatu
VUT
true
2
1
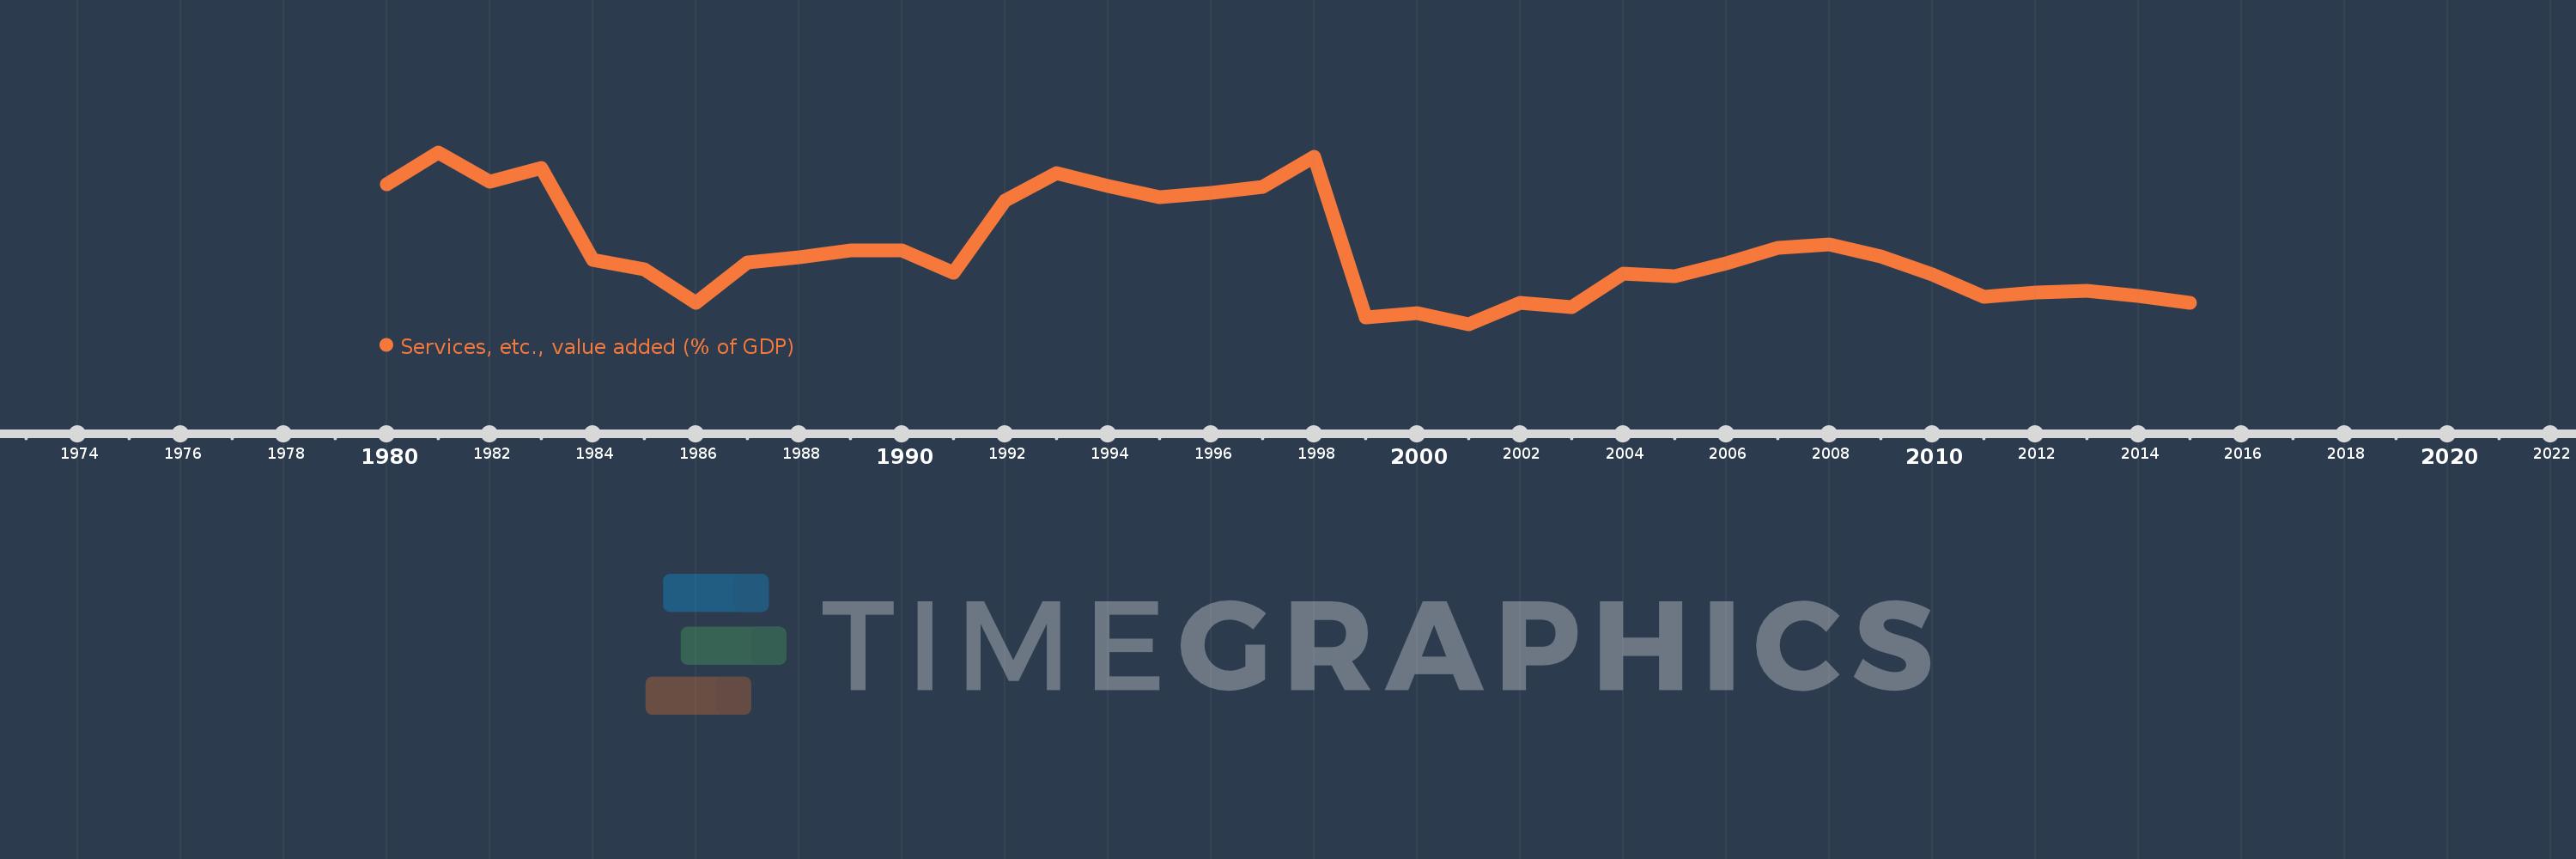
Services, etc., value added (% of GDP)
2015,2014,2013,2012,2011,2010,2009,2008,2007,2006,2005,2004,2003,2002,2001,2000,1999,1998,1997,1996,1995,1994,1993,1992,1991,1990,1989,1988,1987,1986,1985,1984,1983,1982,1981,1980
Estas estatísticas em outros países:
AfghanistanAlbaniaAlgeriaAndorraAngolaAntigua and BarbudaArab WorldArgentinaArmeniaArubaAustraliaAustriaAzerbaijanBahamas, TheBahrainBangladeshBarbadosBelarusBelgiumBelizeBeninBermudaBhutanBoliviaBosnia and HerzegovinaBotswanaBrazilBrunei DarussalamBulgariaBurkina FasoBurundiCabo VerdeCambodiaCameroonCanadaCaribbean small statesCentral African RepublicCentral Europe and the BalticsChadChileChinaColombiaComorosCongo, Dem. Rep.Congo, Rep.Costa RicaCote d'IvoireCroatiaCubaCyprusCzech RepublicDenmarkDjiboutiDominicaDominican RepublicEarly-demographic dividendEast Asia & PacificEast Asia & Pacific (excluding high income)East Asia & Pacific (IDA & IBRD countries)EcuadorEgypt, Arab Rep.El SalvadorEquatorial GuineaEritreaEstoniaEthiopiaEuro areaEurope & Central AsiaEurope & Central Asia (excluding high income)Europe & Central Asia (IDA & IBRD countries)European UnionFaroe IslandsFijiFinlandFragile and conflict affected situationsFranceGabonGambia, TheGeorgiaGermanyGhanaGreeceGrenadaGuatemalaGuineaGuinea-BissauGuyanaHeavily indebted poor countries (HIPC)High incomeHondurasHong Kong SAR, ChinaHungaryIBRD onlyIcelandIDA & IBRD totalIDA blendIDA onlyIDA totalIndiaIndonesiaIran, Islamic Rep.IrelandItalyJamaicaJapanJordanKazakhstanKenyaKiribatiKorea, Rep.KosovoKuwaitKyrgyz RepublicLao PDRLate-demographic dividendLatin America & Caribbean Latin America & Caribbean (excluding high income)Latin America & the Caribbean (IDA & IBRD countries)LatviaLeast developed countries: UN classificationLebanonLesothoLibyaLithuaniaLow & middle incomeLow incomeLower middle incomeLuxembourgMacao SAR, ChinaMacedonia, FYRMadagascarMalawiMalaysiaMaldivesMaliMaltaMarshall IslandsMauritaniaMauritiusMexicoMicronesia, Fed. Sts.Middle East & North AfricaMiddle East & North Africa (excluding high income)Middle East & North Africa (IDA & IBRD countries)Middle incomeMoldovaMongoliaMontenegroMoroccoMozambiqueMyanmarNamibiaNepalNetherlandsNew CaledoniaNew ZealandNicaraguaNigerNigeriaNorth AmericaNorwayOECD membersOmanOther small statesPacific island small statesPakistanPalauPanamaPapua New GuineaParaguayPeruPhilippinesPolandPortugalPost-demographic dividendPre-demographic dividendPuerto RicoQatarRomaniaRussian FederationRwandaSao Tome and PrincipeSaudi ArabiaSenegalSerbiaSeychellesSierra LeoneSingaporeSlovak RepublicSloveniaSmall statesSolomon IslandsSomaliaSouth AfricaSouth AsiaSouth Asia (IDA & IBRD)SpainSri LankaSt. Kitts and NevisSt. LuciaSt. Vincent and the GrenadinesSub-Saharan Africa Sub-Saharan Africa (excluding high income)Sub-Saharan Africa (IDA & IBRD countries)SudanSurinameSwazilandSwedenSwitzerlandSyrian Arab RepublicTajikistanTanzaniaThailandTimor-LesteTogoTongaTrinidad and TobagoTunisiaTurkeyTurkmenistanTuvaluUgandaUkraineUnited KingdomUnited StatesUpper middle incomeUruguayUzbekistanVanuatuVenezuela, RBVietnamWest Bank and GazaWorldYemen, Rep.ZambiaZimbabwe Linha do tempo:
Nesta escala de tempo está apresentado um gráfico de 1980 ano até 2015 ano Vanuatu. Dados de 1979 ano ausente. O número de observações reais por data: 36.
Fonte (nome):
Indicadores de desenvolvimento mundial
Fonte (organização):
World Bank national accounts data, and OECD National Accounts data files.
Categorias:
Economy & Growth
Foi atualizado:
23 abr 2017 ano
Indicadores de alterações dos valores ao longo dos anos
Mínimo:
61.023
1 jan 2001 ano
Máximo:
74.513
1 jan 1981 ano
Na data de observação
Valor
Mudança absoluta
A alteração em relação ao valor anterior
1 jan 1980 ano
72.0
+72.0
0.0%
1 jan 1981 ano
74.513
+2.513
3.49%
1 jan 1982 ano
72.182
-2.331
-3.13%
1 jan 1983 ano
73.306
+1.124
1.56%
1 jan 1984 ano
66.051
-7.255
-9.9%
1 jan 1985 ano
65.363
-0.688
-1.04%
1 jan 1986 ano
62.733
-2.631
-4.02%
1 jan 1987 ano
65.843
+3.111
4.96%
1 jan 1988 ano
66.289
+0.446
0.68%
1 jan 1989 ano
66.793
+0.505
0.76%
1 jan 1990 ano
66.802
+0.008
0.01%
1 jan 1991 ano
65.036
-1.766
-2.64%
1 jan 1992 ano
70.72
+5.684
8.74%
1 jan 1993 ano
72.897
+2.177
3.08%
1 jan 1994 ano
71.881
-1.016
-1.39%
1 jan 1995 ano
71.018
-0.863
-1.2%
1 jan 1996 ano
71.319
+0.301
0.42%
1 jan 1997 ano
71.808
+0.489
0.69%
1 jan 1998 ano
74.185
+2.377
3.31%
1 jan 1999 ano
61.584
-12.602
-16.99%
1 jan 2000 ano
61.906
+0.322
0.52%
1 jan 2001 ano
61.023
-0.883
-1.43%
1 jan 2002 ano
62.721
+1.698
2.78%
1 jan 2003 ano
62.398
-0.323
-0.51%
1 jan 2004 ano
65.018
+2.62
4.2%
1 jan 2005 ano
64.767
-0.251
-0.39%
1 jan 2006 ano
65.772
+1.005
1.55%
1 jan 2007 ano
67.027
+1.255
1.91%
1 jan 2008 ano
67.322
+0.295
0.44%
1 jan 2009 ano
66.375
-0.947
-1.41%
1 jan 2010 ano
64.955
-1.42
-2.14%
1 jan 2011 ano
63.194
-1.761
-2.71%
1 jan 2012 ano
63.48
+0.287
0.45%
1 jan 2013 ano
63.616
+0.135
0.21%
1 jan 2014 ano
63.218
-0.397
-0.62%
1 jan 2015 ano
62.701
-0.518
-0.82%
Classificação de países por estatísticas atuais por anos


Comentários: