29
/pt/
pt
AIzaSyAYiBZKx7MnpbEhh9jyipgxe19OcubqV5w
April 1, 2024
94251
Bulgaria
BGR
true
2
1
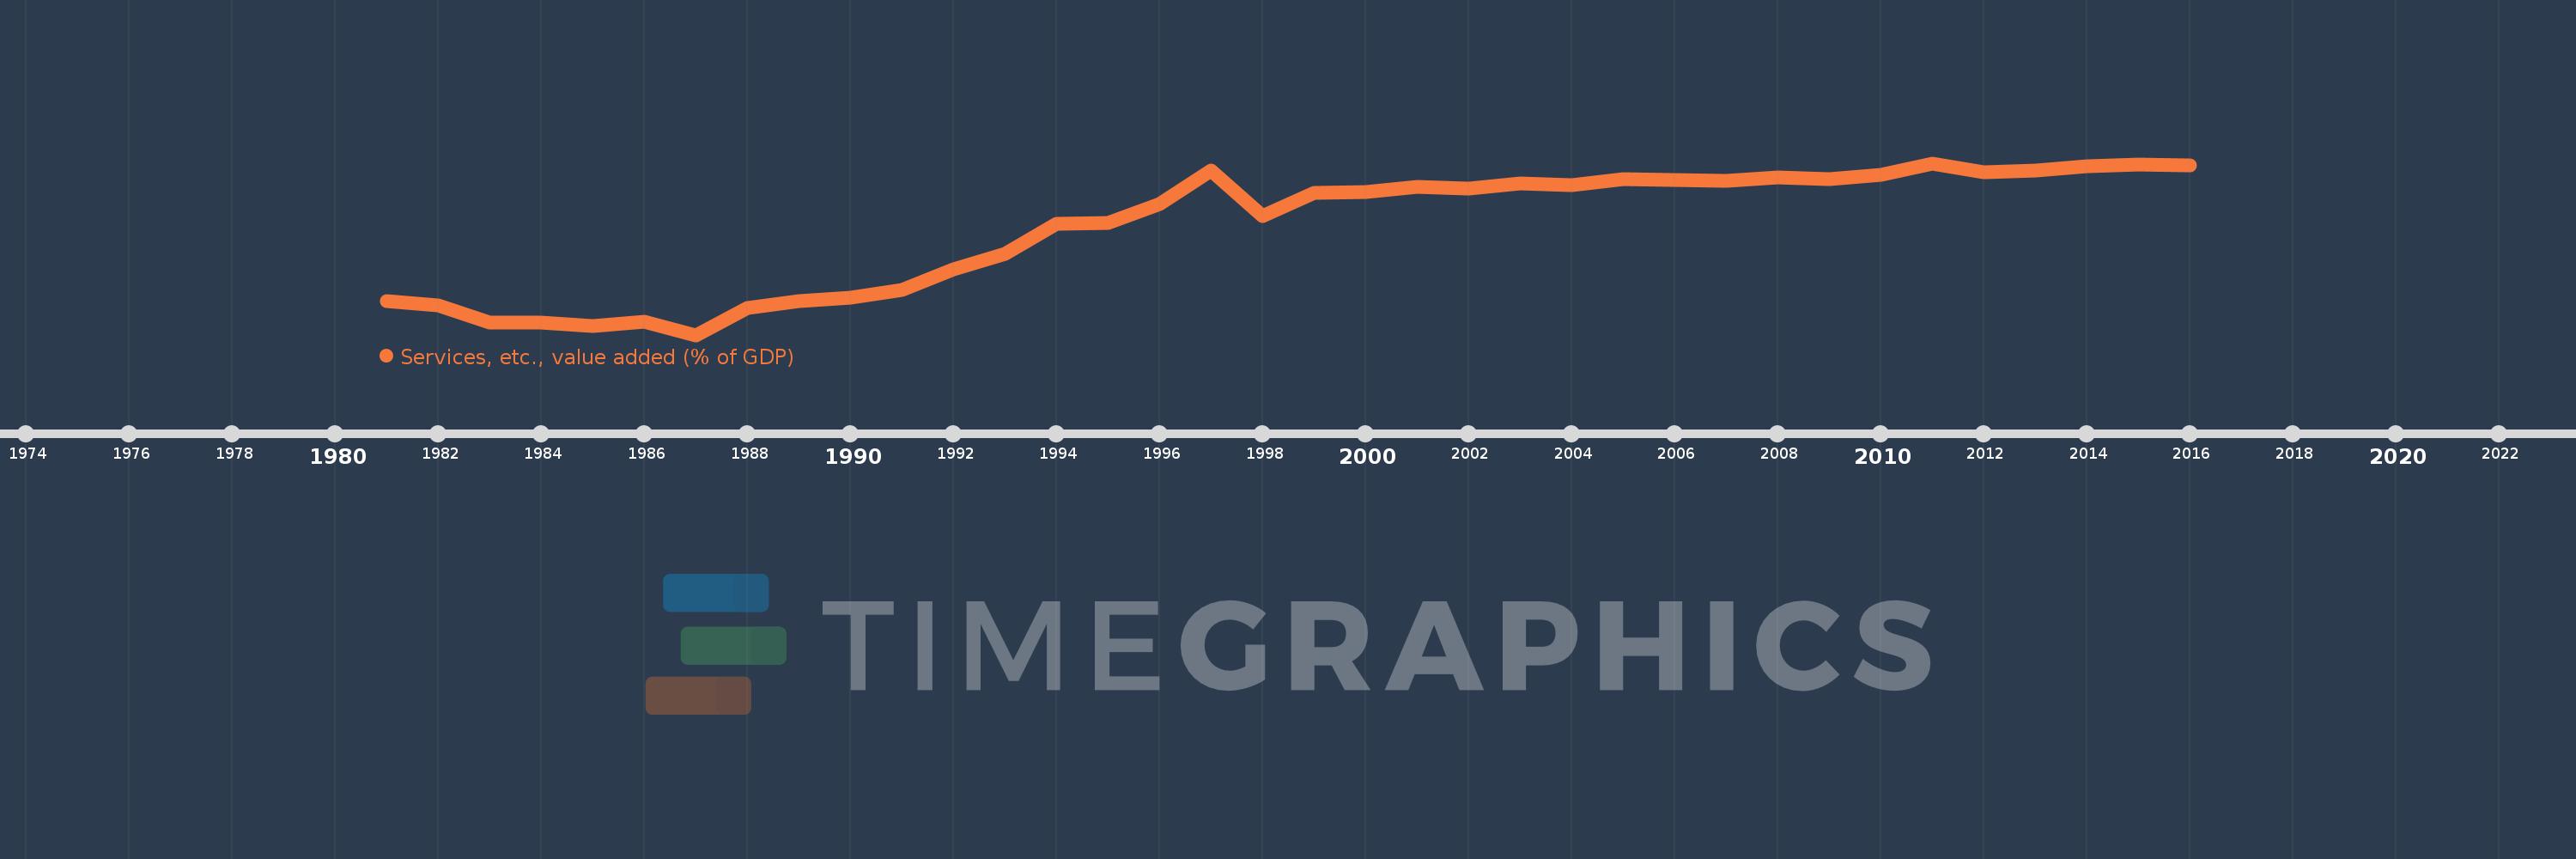
Services, etc., value added (% of GDP)
2016,2015,2014,2013,2012,2011,2010,2009,2008,2007,2006,2005,2004,2003,2002,2001,2000,1999,1998,1997,1996,1995,1994,1993,1992,1991,1990,1989,1988,1987,1986,1985,1984,1983,1982,1981
Estas estatísticas em outros países:
AfghanistanAlbaniaAlgeriaAndorraAngolaAntigua and BarbudaArab WorldArgentinaArmeniaArubaAustraliaAustriaAzerbaijanBahamas, TheBahrainBangladeshBarbadosBelarusBelgiumBelizeBeninBermudaBhutanBoliviaBosnia and HerzegovinaBotswanaBrazilBrunei DarussalamBulgariaBurkina FasoBurundiCabo VerdeCambodiaCameroonCanadaCaribbean small statesCentral African RepublicCentral Europe and the BalticsChadChileChinaColombiaComorosCongo, Dem. Rep.Congo, Rep.Costa RicaCote d'IvoireCroatiaCubaCyprusCzech RepublicDenmarkDjiboutiDominicaDominican RepublicEarly-demographic dividendEast Asia & PacificEast Asia & Pacific (excluding high income)East Asia & Pacific (IDA & IBRD countries)EcuadorEgypt, Arab Rep.El SalvadorEquatorial GuineaEritreaEstoniaEthiopiaEuro areaEurope & Central AsiaEurope & Central Asia (excluding high income)Europe & Central Asia (IDA & IBRD countries)European UnionFaroe IslandsFijiFinlandFragile and conflict affected situationsFranceGabonGambia, TheGeorgiaGermanyGhanaGreeceGrenadaGuatemalaGuineaGuinea-BissauGuyanaHeavily indebted poor countries (HIPC)High incomeHondurasHong Kong SAR, ChinaHungaryIBRD onlyIcelandIDA & IBRD totalIDA blendIDA onlyIDA totalIndiaIndonesiaIran, Islamic Rep.IrelandItalyJamaicaJapanJordanKazakhstanKenyaKiribatiKorea, Rep.KosovoKuwaitKyrgyz RepublicLao PDRLate-demographic dividendLatin America & Caribbean Latin America & Caribbean (excluding high income)Latin America & the Caribbean (IDA & IBRD countries)LatviaLeast developed countries: UN classificationLebanonLesothoLibyaLithuaniaLow & middle incomeLow incomeLower middle incomeLuxembourgMacao SAR, ChinaMacedonia, FYRMadagascarMalawiMalaysiaMaldivesMaliMaltaMarshall IslandsMauritaniaMauritiusMexicoMicronesia, Fed. Sts.Middle East & North AfricaMiddle East & North Africa (excluding high income)Middle East & North Africa (IDA & IBRD countries)Middle incomeMoldovaMongoliaMontenegroMoroccoMozambiqueMyanmarNamibiaNepalNetherlandsNew CaledoniaNew ZealandNicaraguaNigerNigeriaNorth AmericaNorwayOECD membersOmanOther small statesPacific island small statesPakistanPalauPanamaPapua New GuineaParaguayPeruPhilippinesPolandPortugalPost-demographic dividendPre-demographic dividendPuerto RicoQatarRomaniaRussian FederationRwandaSao Tome and PrincipeSaudi ArabiaSenegalSerbiaSeychellesSierra LeoneSingaporeSlovak RepublicSloveniaSmall statesSolomon IslandsSomaliaSouth AfricaSouth AsiaSouth Asia (IDA & IBRD)SpainSri LankaSt. Kitts and NevisSt. LuciaSt. Vincent and the GrenadinesSub-Saharan Africa Sub-Saharan Africa (excluding high income)Sub-Saharan Africa (IDA & IBRD countries)SudanSurinameSwazilandSwedenSwitzerlandSyrian Arab RepublicTajikistanTanzaniaThailandTimor-LesteTogoTongaTrinidad and TobagoTunisiaTurkeyTurkmenistanTuvaluUgandaUkraineUnited KingdomUnited StatesUpper middle incomeUruguayUzbekistanVanuatuVenezuela, RBVietnamWest Bank and GazaWorldYemen, Rep.ZambiaZimbabwe Linha do tempo:
Nesta escala de tempo está apresentado um gráfico de 1981 ano até 2016 ano Bulgaria. Dados de 1980 ano ausente. O número de observações reais por data: 36.
Fonte (nome):
Indicadores de desenvolvimento mundial
Fonte (organização):
World Bank national accounts data, and OECD National Accounts data files.
Categorias:
Economy & Growth
Foi atualizado:
23 abr 2017 ano
Indicadores de alterações dos valores ao longo dos anos
Mínimo:
21.74
1 jan 1987 ano
Máximo:
67.839
1 jan 2011 ano
Na data de observação
Valor
Mudança absoluta
A alteração em relação ao valor anterior
1 jan 1981 ano
30.899
+30.899
0.0%
1 jan 1982 ano
29.727
-1.172
-3.79%
1 jan 1983 ano
24.967
-4.759
-16.01%
1 jan 1984 ano
25.122
+0.155
0.62%
1 jan 1985 ano
24.113
-1.009
-4.02%
1 jan 1986 ano
25.254
+1.142
4.73%
1 jan 1987 ano
21.74
-3.514
-13.92%
1 jan 1988 ano
29.092
+7.352
33.82%
1 jan 1989 ano
30.958
+1.866
6.42%
1 jan 1990 ano
31.765
+0.806
2.6%
1 jan 1991 ano
33.777
+2.012
6.33%
1 jan 1992 ano
39.297
+5.52
16.34%
1 jan 1993 ano
43.568
+4.271
10.87%
1 jan 1994 ano
51.515
+7.947
18.24%
1 jan 1995 ano
51.885
+0.37
0.72%
1 jan 1996 ano
56.935
+5.051
9.73%
1 jan 1997 ano
65.771
+8.835
15.52%
1 jan 1998 ano
53.74
-12.031
-18.29%
1 jan 1999 ano
59.981
+6.242
11.61%
1 jan 2000 ano
60.131
+0.15
0.25%
1 jan 2001 ano
61.574
+1.443
2.4%
1 jan 2002 ano
61.046
-0.528
-0.86%
1 jan 2003 ano
62.396
+1.35
2.21%
1 jan 2004 ano
62.073
-0.323
-0.52%
1 jan 2005 ano
63.509
+1.436
2.31%
1 jan 2006 ano
63.252
-0.257
-0.41%
1 jan 2007 ano
63.029
-0.223
-0.35%
1 jan 2008 ano
64.04
+1.011
1.6%
1 jan 2009 ano
63.577
-0.464
-0.72%
1 jan 2010 ano
64.649
+1.072
1.69%
1 jan 2011 ano
67.839
+3.19
4.93%
1 jan 2012 ano
65.455
-2.384
-3.51%
1 jan 2013 ano
65.839
+0.384
0.59%
1 jan 2014 ano
67.085
+1.246
1.89%
1 jan 2015 ano
67.602
+0.518
0.77%
1 jan 2016 ano
67.341
-0.261
-0.39%
Classificação de países por estatísticas atuais por anos


Comentários: