29
/pt/
pt
AIzaSyAYiBZKx7MnpbEhh9jyipgxe19OcubqV5w
April 1, 2024
90525
Botswana
BWA
true
2
1
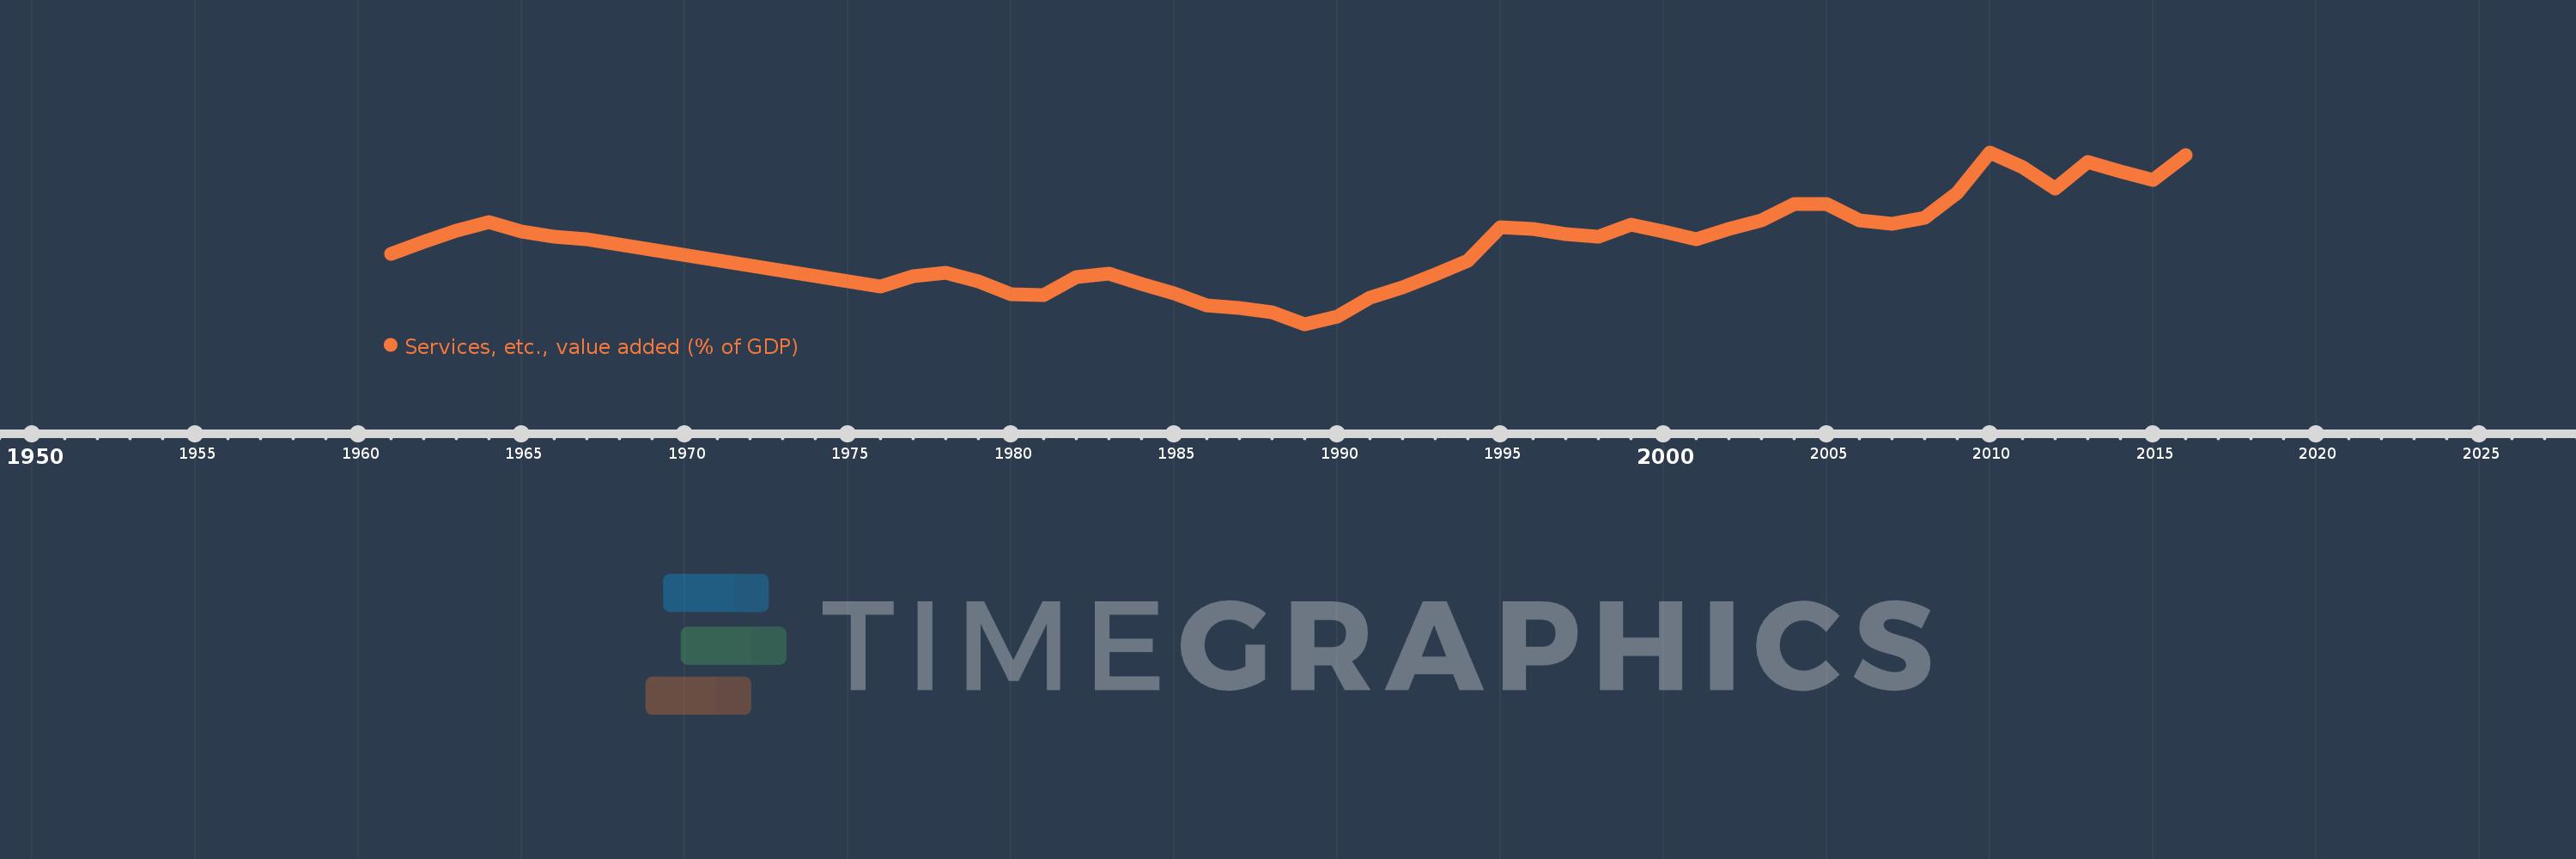
Services, etc., value added (% of GDP)
2016,2015,2014,2013,2012,2011,2010,2009,2008,2007,2006,2005,2004,2003,2002,2001,2000,1999,1998,1997,1996,1995,1994,1993,1992,1991,1990,1989,1988,1987,1986,1985,1984,1983,1982,1981,1980,1979,1978,1977,1976,1967,1966,1965,1964,1963,1962,1961
Estas estatísticas em outros países:
AfghanistanAlbaniaAlgeriaAndorraAngolaAntigua and BarbudaArab WorldArgentinaArmeniaArubaAustraliaAustriaAzerbaijanBahamas, TheBahrainBangladeshBarbadosBelarusBelgiumBelizeBeninBermudaBhutanBoliviaBosnia and HerzegovinaBotswanaBrazilBrunei DarussalamBulgariaBurkina FasoBurundiCabo VerdeCambodiaCameroonCanadaCaribbean small statesCentral African RepublicCentral Europe and the BalticsChadChileChinaColombiaComorosCongo, Dem. Rep.Congo, Rep.Costa RicaCote d'IvoireCroatiaCubaCyprusCzech RepublicDenmarkDjiboutiDominicaDominican RepublicEarly-demographic dividendEast Asia & PacificEast Asia & Pacific (excluding high income)East Asia & Pacific (IDA & IBRD countries)EcuadorEgypt, Arab Rep.El SalvadorEquatorial GuineaEritreaEstoniaEthiopiaEuro areaEurope & Central AsiaEurope & Central Asia (excluding high income)Europe & Central Asia (IDA & IBRD countries)European UnionFaroe IslandsFijiFinlandFragile and conflict affected situationsFranceGabonGambia, TheGeorgiaGermanyGhanaGreeceGrenadaGuatemalaGuineaGuinea-BissauGuyanaHeavily indebted poor countries (HIPC)High incomeHondurasHong Kong SAR, ChinaHungaryIBRD onlyIcelandIDA & IBRD totalIDA blendIDA onlyIDA totalIndiaIndonesiaIran, Islamic Rep.IrelandItalyJamaicaJapanJordanKazakhstanKenyaKiribatiKorea, Rep.KosovoKuwaitKyrgyz RepublicLao PDRLate-demographic dividendLatin America & Caribbean Latin America & Caribbean (excluding high income)Latin America & the Caribbean (IDA & IBRD countries)LatviaLeast developed countries: UN classificationLebanonLesothoLibyaLithuaniaLow & middle incomeLow incomeLower middle incomeLuxembourgMacao SAR, ChinaMacedonia, FYRMadagascarMalawiMalaysiaMaldivesMaliMaltaMarshall IslandsMauritaniaMauritiusMexicoMicronesia, Fed. Sts.Middle East & North AfricaMiddle East & North Africa (excluding high income)Middle East & North Africa (IDA & IBRD countries)Middle incomeMoldovaMongoliaMontenegroMoroccoMozambiqueMyanmarNamibiaNepalNetherlandsNew CaledoniaNew ZealandNicaraguaNigerNigeriaNorth AmericaNorwayOECD membersOmanOther small statesPacific island small statesPakistanPalauPanamaPapua New GuineaParaguayPeruPhilippinesPolandPortugalPost-demographic dividendPre-demographic dividendPuerto RicoQatarRomaniaRussian FederationRwandaSao Tome and PrincipeSaudi ArabiaSenegalSerbiaSeychellesSierra LeoneSingaporeSlovak RepublicSloveniaSmall statesSolomon IslandsSomaliaSouth AfricaSouth AsiaSouth Asia (IDA & IBRD)SpainSri LankaSt. Kitts and NevisSt. LuciaSt. Vincent and the GrenadinesSub-Saharan Africa Sub-Saharan Africa (excluding high income)Sub-Saharan Africa (IDA & IBRD countries)SudanSurinameSwazilandSwedenSwitzerlandSyrian Arab RepublicTajikistanTanzaniaThailandTimor-LesteTogoTongaTrinidad and TobagoTunisiaTurkeyTurkmenistanTuvaluUgandaUkraineUnited KingdomUnited StatesUpper middle incomeUruguayUzbekistanVanuatuVenezuela, RBVietnamWest Bank and GazaWorldYemen, Rep.ZambiaZimbabwe Linha do tempo:
Nesta escala de tempo está apresentado um gráfico de 1961 ano até 2016 ano Botswana. Dados de 1960 ano ausente. O número de observações reais por data: 48.
Fonte (nome):
Indicadores de desenvolvimento mundial
Fonte (organização):
World Bank national accounts data, and OECD National Accounts data files.
Categorias:
Economy & Growth
Foi atualizado:
23 abr 2017 ano
Indicadores de alterações dos valores ao longo dos anos
Mínimo:
28.511
1 jan 1989 ano
Máximo:
64.729
1 jan 2010 ano
Na data de observação
Valor
Mudança absoluta
A alteração em relação ao valor anterior
1 jan 1961 ano
43.261
+43.261
0.0%
1 jan 1962 ano
45.848
+2.587
5.98%
1 jan 1963 ano
48.23
+2.382
5.2%
1 jan 1964 ano
50.098
+1.868
3.87%
1 jan 1965 ano
48.125
-1.973
-3.94%
1 jan 1966 ano
46.951
-1.174
-2.44%
1 jan 1967 ano
46.341
-0.61
-1.3%
1 jan 1976 ano
36.486
-9.856
-21.27%
1 jan 1977 ano
38.561
+2.075
5.69%
1 jan 1978 ano
39.34
+0.778
2.02%
1 jan 1979 ano
37.606
-1.734
-4.41%
1 jan 1980 ano
34.823
-2.783
-7.4%
1 jan 1981 ano
34.574
-0.249
-0.71%
1 jan 1982 ano
38.444
+3.87
11.19%
1 jan 1983 ano
39.132
+0.689
1.79%
1 jan 1984 ano
37.027
-2.105
-5.38%
1 jan 1985 ano
35.026
-2.001
-5.4%
1 jan 1986 ano
32.409
-2.618
-7.47%
1 jan 1987 ano
31.98
-0.429
-1.32%
1 jan 1988 ano
31.053
-0.927
-2.9%
1 jan 1989 ano
28.511
-2.542
-8.19%
1 jan 1990 ano
30.083
+1.573
5.52%
1 jan 1991 ano
34.127
+4.043
13.44%
1 jan 1992 ano
36.247
+2.12
6.21%
1 jan 1993 ano
39.0
+2.754
7.6%
1 jan 1994 ano
41.943
+2.943
7.55%
1 jan 1995 ano
48.943
+7.0
16.69%
1 jan 1996 ano
48.622
-0.321
-0.66%
1 jan 1997 ano
47.465
-1.157
-2.38%
1 jan 1998 ano
47.03
-0.435
-0.92%
1 jan 1999 ano
49.481
+2.45
5.21%
1 jan 2000 ano
47.995
-1.485
-3.0%
1 jan 2001 ano
46.423
-1.573
-3.28%
1 jan 2002 ano
48.663
+2.241
4.83%
1 jan 2003 ano
50.425
+1.761
3.62%
1 jan 2004 ano
53.764
+3.339
6.62%
1 jan 2005 ano
53.859
+0.096
0.18%
1 jan 2006 ano
50.334
-3.526
-6.55%
1 jan 2007 ano
49.758
-0.576
-1.14%
1 jan 2008 ano
50.964
+1.206
2.42%
1 jan 2009 ano
56.173
+5.21
10.22%
1 jan 2010 ano
64.729
+8.556
15.23%
1 jan 2011 ano
61.56
-3.169
-4.9%
1 jan 2012 ano
57.036
-4.523
-7.35%
1 jan 2013 ano
62.734
+5.698
9.99%
1 jan 2014 ano
60.737
-1.997
-3.18%
1 jan 2015 ano
58.911
-1.827
-3.01%
1 jan 2016 ano
64.186
+5.275
8.95%
Classificação de países por estatísticas atuais por anos


Comentários: